其它相关《NVIDIA查看CPU、内存、GPU使用情况》
0 背景
在用英伟达显卡做深度学习训练或推理时,我们常用nvidia-smi指令来查看显卡的使用情况,如图所示
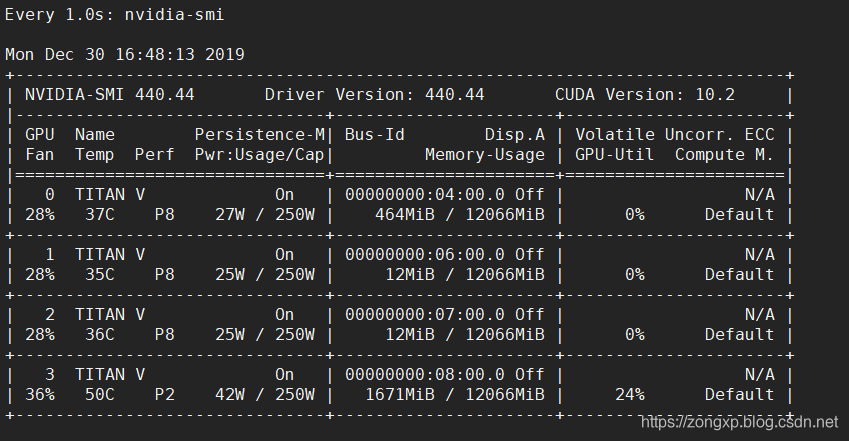
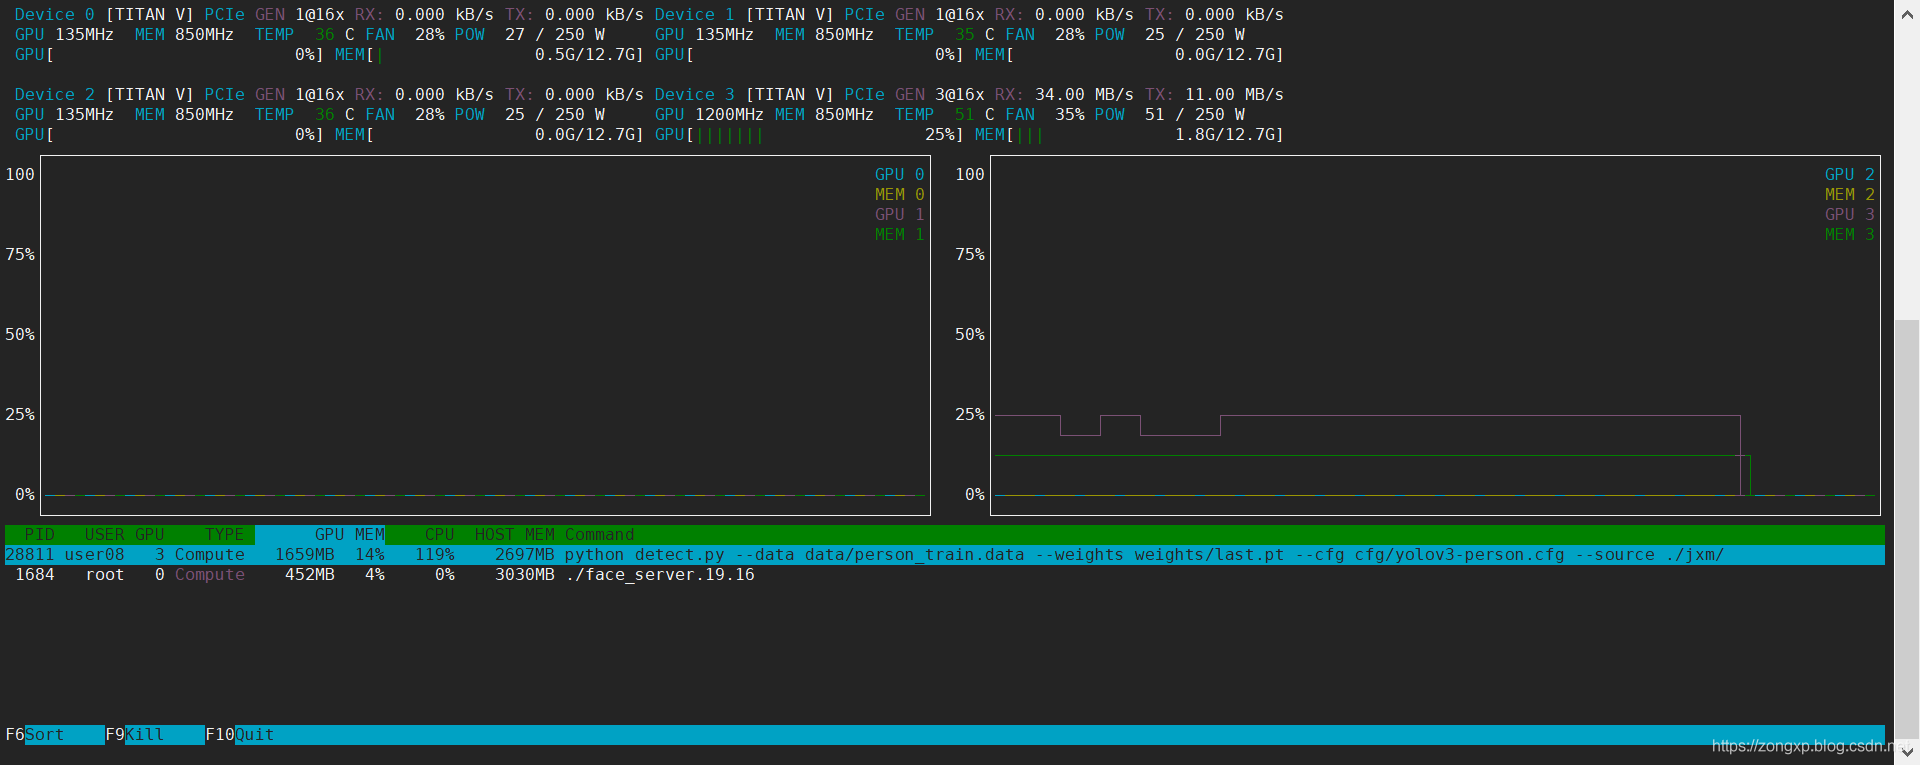
这种方法可以看出每张显卡内存和GPU利用率的实时情况,但看不出历史数据和变化曲线,这个时候就需要用到nvtop了。
Nvtop代表NVidia TOP,这是用于NVIDIA GPU的任务监视器。它可以处理多个GPU,并以熟悉的方式打印有关它们的信息。如图所示,很直观的显示了每张显卡的内存、GPU利用率曲线。本文对该工具的安装使用进行介绍。
1 安装方法
在Ubuntu disco (19.04) / Debian buster (stable)系统中,可以直接使用apt安装
sudo apt install nvtop
如果是在旧的系统,如ubuntu16.04等,则需要通过源码安装,方法如下
# 安装依赖
sudo apt install cmake libncurses5-dev libncursesw5-dev git

# 下载源码
git clone https://github.com/Syllo/nvtop.git
mkdir -p nvtop/build && cd nvtop/build
cmake ..

# 如果报错"Could NOT find NVML (missing: NVML_INCLUDE_DIRS)"
# 则执行下边的语句,否则跳过
cmake .. -DNVML_RETRIEVE_HEADER_ONLINE=True
# 编译
make
sudo make install
2 使用方法
安装完之后,可以执行nvtop -h来查看使用方法,介绍的很详细了,如果现实全部信息,直接nvtop就可以现实出我们上边的结果
nvtop version 1.0.0
Available options:
-d --delay : Select the refresh rate (1 == 0.1s)
-v --version : Print the version and exit
-s --gpu-select : Column separated list of GPU IDs to monitor
-i --gpu-ignore : Column separated list of GPU IDs to ignore
-p --no-plot : Disable bar plot
-C --no-color : No colors
-N --no-cache : Always query the system for user names and command line information
-f --freedom-unit : Use fahrenheit
-E --encode-hide : Set encode/decode auto hide time in seconds (default 30s, negative = always on screen)
-h --help : Print help and exit
————————————————
版权声明:本文为CSDN博主「ZONG_XP」的原创文章,遵循CC 4.0 BY-SA版权协议,转载请附上原文出处链接及本声明。
原文链接:https://blog.csdn.net/zong596568821xp/article/details/103712188