<!DOCTYPE html>
<html>
<head>
<meta charset="UTF-8">
<title></title>
<script src="https://cdn.bootcss.com/echarts/3.5.4/echarts.min.js"></script>
</head>
<body>
<div id="main" style=" 1000px;height:400px;"></div>
<script type="text/javascript">
var myChart = echarts.init(document.getElementById('main'));
var option = {
backgroundColor: '#23243a',
tooltip: { //提示框组件
trigger: 'axis',
formatter: '{b}<br />{a0}: {c0}<br />{a1}: {c1}',
axisPointer: {
type: 'shadow',
label: {
backgroundColor: '#6a7985'
}
},
textStyle: {
color: '#fff',
fontStyle: 'normal',
fontFamily: '微软雅黑',
fontSize: 12,
}
},
grid: {
left: '1%',
right: '4%',
bottom: '6%',
top: 30,
padding: '0 0 10 0',
containLabel: true,
},
legend: { //图例组件,颜色和名字
right: 10,
top: 0,
itemGap: 16,
itemWidth: 18,
itemHeight: 10,
data: [{
name: '流入',
//icon:'image://../wwwroot/js/url2.png', //路径
},
{
name: '流出',
}
],
textStyle: {
color: '#a8aab0',
fontStyle: 'normal',
fontFamily: '微软雅黑',
fontSize: 12,
}
},
xAxis: [{
type: 'category',
boundaryGap: true, //坐标轴两边留白
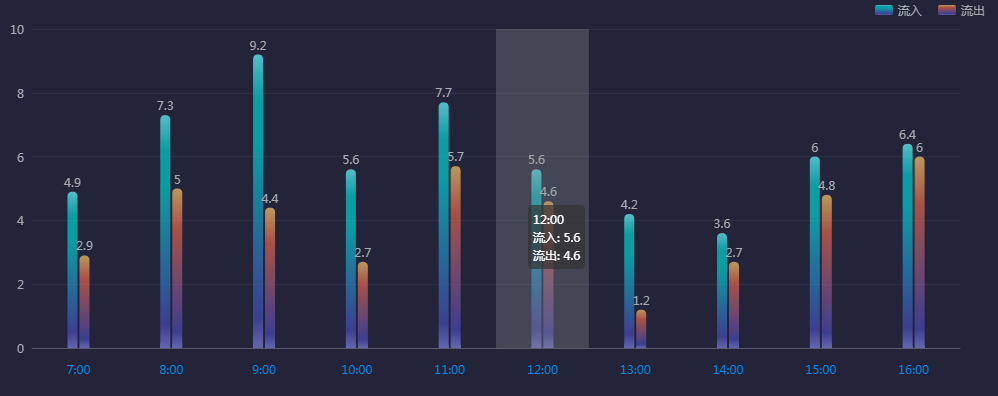
data: ['7:00', '8:00', '9:00', '10:00', '11:00', '12:00', '13:00', '14:00', '15:00', '16:00'],
axisLabel: { //坐标轴刻度标签的相关设置。
interval: 0, //设置为 1,表示『隔一个标签显示一个标签』
margin: 15,
textStyle: {
color: '#078ceb',
fontStyle: 'normal',
fontFamily: '微软雅黑',
fontSize: 12,
}
},
axisTick: { //坐标轴刻度相关设置。
show: false,
},
axisLine: { //坐标轴轴线相关设置
lineStyle: {
color: '#fff',
opacity: 0.2
}
},
splitLine: { //坐标轴在 grid 区域中的分隔线。
show: false,
}
}],
yAxis: [{
type: 'value',
splitNumber: 5,
axisLabel: {
textStyle: {
color: '#a8aab0',
fontStyle: 'normal',
fontFamily: '微软雅黑',
fontSize: 12,
}
},
axisLine: {
show: false
},
axisTick: {
show: false
},
splitLine: {
show: true,
lineStyle: {
color: ['#fff'],
opacity: 0.06
}
}
}],
series: [{
name: '流入',
type: 'bar',
data: [4.9, 7.3, 9.2, 5.6, 7.7, 5.6, 4.2, 3.6, 6, 6.4],
barWidth: 10,
barGap: 0, //柱间距离
label: { //图形上的文本标签
normal: {
show: true,
position: 'top',
textStyle: {
color: '#a8aab0',
fontStyle: 'normal',
fontFamily: '微软雅黑',
fontSize: 12,
},
},
},
itemStyle: { //图形样式
normal: {
barBorderRadius: [5, 5, 0, 0],
color: new echarts.graphic.LinearGradient(0, 0, 0, 1, [{
offset: 1,
color: 'rgba(127, 128, 225, 0.7)'
}, {
offset: 0.9,
color: 'rgba(72, 73, 181, 0.7)'
}, {
offset: 0.31,
color: 'rgba(0, 208, 208, 0.7)'
}, {
offset: 0.15,
color: 'rgba(0, 208, 208, 0.7)'
}, {
offset: 0,
color: 'rgba(104, 253, 255, 0.7)'
}], false),
},
},
},
{
name: '流出',
type: 'bar',
data: [2.9, 5, 4.4, 2.7, 5.7, 4.6, 1.2, 2.7, 4.8, 6.0],
barWidth: 10,
barGap: 0.2, //柱间距离
label: { //图形上的文本标签
normal: {
show: true,
position: 'top',
textStyle: {
color: '#a8aab0',
fontStyle: 'normal',
fontFamily: '微软雅黑',
fontSize: 12,
},
},
},
itemStyle: { //图形样式
normal: {
barBorderRadius: [5, 5, 0, 0],
color: new echarts.graphic.LinearGradient(0, 0, 0, 1, [{
offset: 1,
color: 'rgba(127, 128, 225, 0.7)'
}, {
offset: 0.9,
color: 'rgba(72, 73, 181, 0.7)'
}, {
offset: 0.25,
color: 'rgba(226, 99, 74, 0.7)'
}, {
offset: 0,
color: 'rgba(253, 200, 106, 0.7)'
}], false),
},
},
}
]
};
myChart.setOption(option);
</script>
</body>
</html>渐变颜色设置:
itemStyle: { //图形样式
	normal: {
		barBorderRadius: [5, 5, 0, 0],
		color: new echarts.graphic.LinearGradient(0, 0, 0, 1, [{
			offset: 1,
			color: 'rgba(127, 128, 225, 0.7)'
		}, {
			offset: 0.9,
			color: 'rgba(72, 73, 181, 0.7)'
		}, {
			offset: 0.25,
			color: 'rgba(226, 99, 74, 0.7)'
		}, {
			offset: 0,
			color: 'rgba(253, 200, 106, 0.7)'
		}], false),
	},
},