react中想要实现折线图和饼图的功能,需要引入react-echarts包,然后再实现折线图的功能。我这里引用的版本是:0.1.1。其他的写法参echarts官网即可。下面详细讲解的是我在react+redux+router+webpack+antd脚手架上面完成的折线图和饼图。
这篇文章主要讲解的是折线图,折线图主要分为普通的折线图和大面积折线图,普通的折线图又分为三种获取单个折线图、两个折线图、多个每行两个折线图。
- 大面积折线图,echarts3官网大面积折线图官网实例如图,网址:http://echarts.baidu.com/demo.html#area-simple
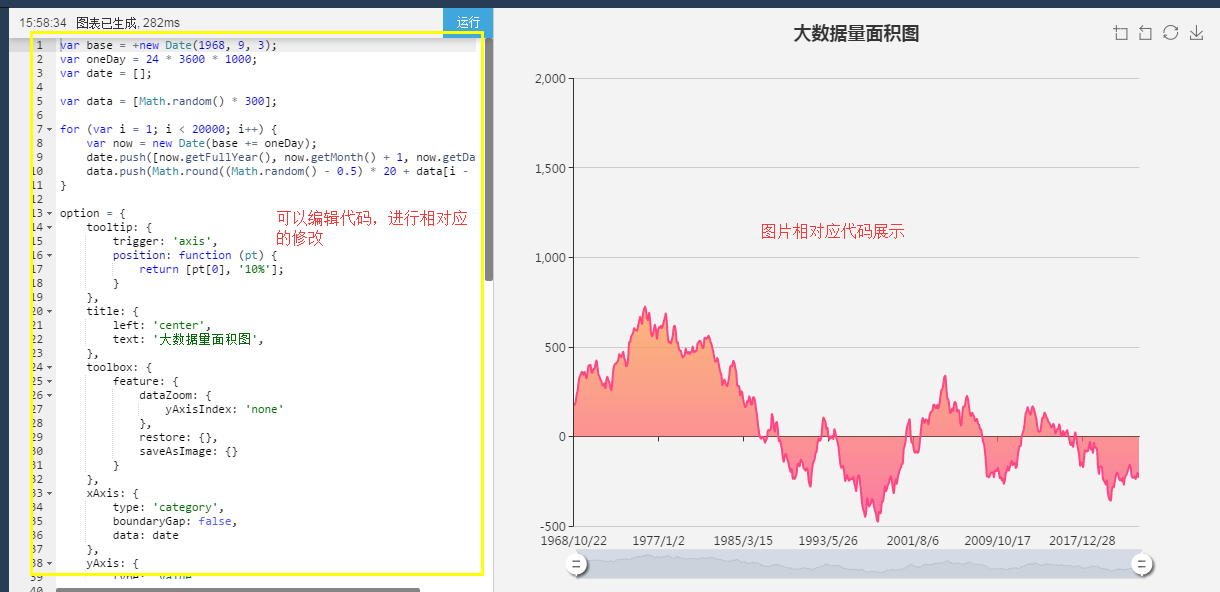
将代码粘贴复制到自己的脚手架相对应的组件中即可,以下是我的一些功能实现,详细的讲解就在代码注释上面


import React, {PropTypes, Component} from 'react';//引入react包,用于编写react组件
import { Router, Route, browserHistory} from 'react-router';//引入react-router包,用于路由跳转
import {Row,Col} from 'antd';//引入蚂蚁金服的antUI组件中的row和col(栅格),管理布局
import ECharts from 'react-echarts';//引入react-echarts包,实现echarts实现
import '../../../common/sass/activity/activity.scss';//引入自己的scss文件
import '../../../common/sass/public/customButton.scss';


//设置全局变量
var optionDatas={},
    converRate=null,
    dateArray=[],
    rateArray=[];
class ReactEcharts extends React.Component {
    constructor(props) {
        super(props);
        //初始化修改状态属性
        this.state = {
            visible: false,
            activityName:''
        }
    }
    /*生命周期函数--->该方法在完成首次渲染之前被调用-》调用action中ajax方法,获取数据*/
    componentWillMount() {
        this.props.atyactions.queryAtyView();
    }

    /**
     *条件:当组件确定要更新,在 render 之前调用
     *用处:这个时候可以确定一定会更新组件,可以执行更新前的操作
     *注意:方法中不能使用 setState ,setState 的操作应该在 componentWillReceiveProps 方法中调用
     * @param nextProps
     * @param nextState
     */
    componentWillUpdate(nextProps, nextState) {
        if(nextProps.atyViewDatas.queryAtyInfoById.status==="yes"){
            dateArray.length=0;
            rateArray.length=0;
            const array=nextProps.atyViewDatas.queryAtyInfoById.returnDatas;
            const converRateArray=array[0].converRateArray;
            converRateArray.map((item, index) =>{
                 dateArray.push(item.activityDate);
                 rateArray.push(item.converRate);
                 converRate=array[0].converRate;
            } );
        }else{
            converRate=null,
            dateArray=[],
            rateArray=[];
        }
        //echarts中获取数据的option设置
        optionDatas ={
            tooltip : {
                trigger: 'axis',
                position: function (pt) {
                    return [pt[0], '10%'];
                }
            },
            title: {
                text: '整体转化率:'+ converRate*100+"%" +"                                                                                                     "
                     + '更多详情请点击>>',
                //backgroundColor:'#278BDD',
                //borderColor: '#ccc',
                //borderWidth: 0,
                padding: 10,
                link:'/activityManage' ,
                textStyle: {
                    fontFamily: '微软雅黑',
                    fontSize: 14,
                    fontStyle: 'normal',
                    fontWeight: 'normal',
                }
            },
            toolbox: {
                feature: {
                    dataZoom: {
                        yAxisIndex: 'none'
                    },
                    restore: {}
                }
            },
            //布局设置,类似于margin
            grid: {
                left: '3%',
                right: '2%',
                bottom: '10%',
                containLabel: true
            },
            //X轴数据设置dateArray
            xAxis : [
                {
                    type : 'category',
                    boundaryGap : false,
                    data : dateArray
                }
            ],
            yAxis : [
                {
                    type : 'value'
                }
            ],
            //大面积折线图最下面的伸拉条设置,展示30天数据
            dataZoom: [{
                type: 'inside',
                start: 0,
                end: 30
            }, {
                start: 0,
                end: 30,
                //handleIcon: 'M10.7,11.9v-1.3H9.3v1.3c-4.9,0.3-8.8,4.4-8.8,9.4c0,5,3.9,9.1,8.8,9.4v1.3h1.3v-1.3c4.9-0.3,8.8-4.4,8.8-9.4C19.5,16.3,15.6,12.2,10.7,11.9z M13.3,24.4H6.7V23h6.6V24.4z M13.3,19.6H6.7v-1.4h6.6V19.6z',
                handleSize: '80%',
                handleStyle: {
                    color: '#fff',
                    shadowBlur: 3,
                    shadowColor: 'rgba(0, 0, 0, 0.6)',
                    shadowOffsetX: 2,
                    shadowOffsetY: 2
                }
            }],
            //折线图图标和线条设置以及Y轴数据设置rateArray
            series : [
                {
                    name:'转化率',
                    type:'line',
                    stack: '总量',
                    symbol:'star',//节点性状
                    itemStyle:{
                        normal:{
                            color: "#278BDD" //图标颜色
                        }
                    },
                    lineStyle:{
                        normal:{
                            3,  //连线粗细
                            color: "#278BDD"  //连线颜色
                        }
                    },
                    data:rateArray
                }
            ]
        };
    }
    render(){
        return(
            <div className="atyViewBg">
                <Row style={{marginRight:-20}}>
                        <Col span={24} className="ehcharts">
                            <ECharts option={optionDatas} />
                        </Col>
                </Row>
            </div>
        );
    }

}

//定义组件默认的属性值(如果父组见没有传递数据,使用默认数据)
ReactEcharts.defaultProps = {};
//校验从父组件传递的属性值是否符合
ReactEcharts.propTypes = {};
//将ReactEcharts组建开放,其他组件只要在文件开始引入改组件即可引用
export default ReactEcharts;
效果图如下:

- 普通折线图,echarts3官网普通折线图官网实例如图,网址:http://echarts.baidu.com/demo.html#area-stack
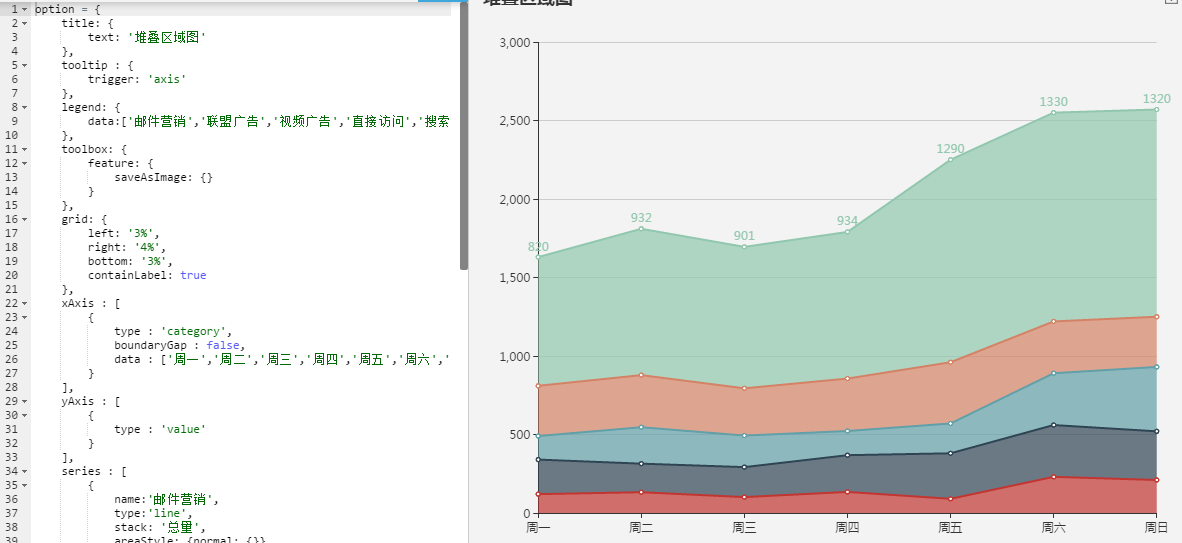
在这里我讲解两种折线图动态获取,一个是每次获取两个折线图(除了数据不一样,其他一样),另一个是获取多个两个折线图。主要用到的方法是ES6中的map循环,想了解该语法,请访问如下网址:http://es6.ruanyifeng.com/#docs/set-map
- 每次获取两个折线图(除了数据不一样,其他一样),详细讲解在代码中,和上面重复的部分就不再详细讲解。
  1 import React, {PropTypes, Component} from 'react';
  2 import ECharts from 'react-echarts';
  3 import {Row, Col} from 'antd';
  4 import '../../../../common/sass/evaluate/evaluate.scss';
  5
  6 export default class OverallConverRate extends React.Component {
  7     //
  8     constructor(props) {
  9         super(props);
 10         let d = new Date();
 11         this.state = {
 12             echartsFlag: false,
 13             queryParam: {
 14                 'activityId': this.props.evaluateData.activity.activityId,//活动ID
 15                 'statisDate': d.getFullYear() + "" + (d.getMonth() + 1) + "" + d.getDate(),//查询日期默认当天
 16                 'userType': 1,//用户类型:1是全部用户,2是注册用户
 17             }
 18         }
 19     }
 20     componentWillMount() {
 21         //调用action中的ajax方法,获取数据
 22         this.props.actions.overAllConverRateData(this.state.queryParam);
 23     }
 24
 25     componentWillReceiveProps(nextProps) {
 26         if (nextProps.evaluateData.allConverRateData.dateArr.length > 0) {
 27             this.setState({echartsFlag: true});
 28         }
 29     }
 30     //echart方法
 31     echarts() {
 32         const optionUsers = {
 33             tooltip: {
 34                 trigger: 'axis'
 35             },
 36             grid: {
 37                 left: '5%',
 38                 right: '5%',
 39                 top:'10px',
 40                 bottom: '5%',
 41                 containLabel: true
 42             },
 43             xAxis: [
 44                 {
 45                     type : 'category',
 46                     boundaryGap : false,
 47                     axisTick:{
 48                         show:false,//是否显示坐标轴刻度
 49                     },
 50                     /*设置X轴字体样式*/
 51                     axisLabel: {
 52                         show: true,
 53                         interval: 0,
 54                         rotate: 20,//倾斜30度
 55                         textStyle: {
 56                             color: '#666',
 57                             fontSize: 12,
 58                             fontFamily: '微软雅黑'
 59                         }
 60                     },
 61                     axisLine: {
 62                         lineStyle:{
 63                             color:'#999'
 64                         }
 65                     },
 66                     data: this.props.evaluateData.allConverRateData.dateArr
 67                 }
 68             ],
 69            yAxis: [
 70                   {
 71                     type : 'value',
 72                     axisTick:{
 73                         show:false,//是否显示坐标轴刻度
 74                     },
 75                     //splitNumber:10,//增加Y轴刻度变多
 76                     /*设置y轴字体样式*/
 77                     axisLabel: {
 78                         show: true,
 79                         formatter: '{value}%',
 80                         textStyle: {
 81                             color: '#666',
 82                             fontSize: 12,
 83                             fontFamily: '微软雅黑'
 84                         }
 85                     },
 86                     axisLine: {
 87                         lineStyle:{
 88                             color:'#999'
 89                         }
 90                     }
 91                 }
 92             ],
 93             series: [
 94                 {
 95                     name: '推荐人次转化率',
 96                     type: 'line',
 97                     stack: '总量',
 98                     symbol: 'star',//节点性状
 99                     itemStyle: {
100                         normal: {
101                             color: "#278BDD" //图标颜色
102                         }
103                     },
104                     lineStyle: {
105                         normal: {
106                              2,  //连线粗细
107                             color: "#278BDD"  //连线颜色
108                         }
109                     },
110                     smooth: true,//折线图是趋缓的
111                     data: this.props.evaluateData.allConverRateData.userRateArr
112                 }
113             ]
114         };
115         const optionItems = {
116             tooltip: {
117                 trigger: 'axis'
118             },
119             grid: {
120                 left: '5%',
121                 right: '0',
122                 top:'10px',
123                 bottom: '5%',
124                 containLabel: true
125             },
126             xAxis: [
127                 {
128                     type : 'category',
129                     boundaryGap : false,
130                     axisTick:{
131                         show:false,//是否显示坐标轴刻度
132                     },
133                     /*设置X轴字体样式*/
134                     axisLabel: {
135                         show: true,
136                         interval: 0,
137                         rotate: 20,//倾斜30度
138                         textStyle: {
139                             color: '#666',
140                             fontSize: 12,
141                             fontFamily: '微软雅黑'
142                         }
143                     },
144                     axisLine: {
145                         lineStyle:{
146                             color:'#999'
147                         }
148                     },
149                     data: this.props.evaluateData.allConverRateData.dateArr
150                 }
151             ],
152             yAxis: [
153                {
154                     type : 'value',
155                     axisTick:{
156                         show:false,//是否显示坐标轴刻度
157                     },
158                     //splitNumber:10,//增加Y轴刻度变多
159                     /*设置y轴字体样式*/
160                     axisLabel: {
161                         show: true,
162                         formatter: '{value}%',
163                         textStyle: {
164                             color: '#666',
165                             fontSize: 12,
166                             fontFamily: '微软雅黑'
167                         }
168                     },
169                     axisLine: {
170                         lineStyle:{
171                             color:'#999'
172                         }
173                     }
174                 }
175             ],
176             series: [
177                 {
178                     name: '推荐内容转化率',
179                     type: 'line',
180                     stack: '总量',
181                     symbol: 'star',//节点性状
182                     itemStyle: {
183                         normal: {
184                             color: "#278BDD" //图标颜色
185                         }
186                     },
187                     lineStyle: {
188                         normal: {
189                              2,  //连线粗细
190                             color: "#278BDD"  //连线颜色
191                         }
192                     },
193                     smooth: true,//折线图是趋缓的
194                     data: this.props.evaluateData.allConverRateData.itemRateArr
195                 }
196             ]
197         };
198         //推荐人次转化率和推荐内容转化率数组中的最后一个数据,在echart标题上()显示
199         const userRateLast = (this.props.evaluateData.allConverRateData.userRateArr[this.props.evaluateData.allConverRateData.userRateArr.length-1]) ? (this.props.evaluateData.allConverRateData.userRateArr[this.props.evaluateData.allConverRateData.userRateArr.length-1]) +'%': '没有数据';
200         const itemRateLast = (this.props.evaluateData.allConverRateData.itemRateArr[this.props.evaluateData.allConverRateData.itemRateArr.length-1]) ? (this.props.evaluateData.allConverRateData.itemRateArr[this.props.evaluateData.allConverRateData.itemRateArr.length-1]) +'%': '没有数据';
201         if (this.state.echartsFlag) {
202             return <div className="common-echart-body-div">
203                 <Col span={11} className="commont-small-ehcharts">
204                     <Col span={14} offset={1}><h2 className="common-echart-title">推荐人次转化率({userRateLast})</h2></Col>
205                     <ECharts option={optionUsers} />
206                 </Col>
207                 <Col span={2} ><div className="common-echart-border"></div></Col>
208               <Col span={11} className="commont-small-ehcharts">
209               <Col span={14} offset={1}><h2 className="common-echart-title">推荐内容转化率({itemRateLast})</h2></Col>
210                     <ECharts option={optionItems} />
211               </Col>
212             </div>;
213         } else {
214             return '没有折线图';
215         }
216     }
217
218     render() {
219         return (
220             <div className="sceneEvaluateRate">
221                 {this.echarts()}{/*调用echarts()方法*/}
222             </div>
223         );
224     }
225 }
效果图如下:

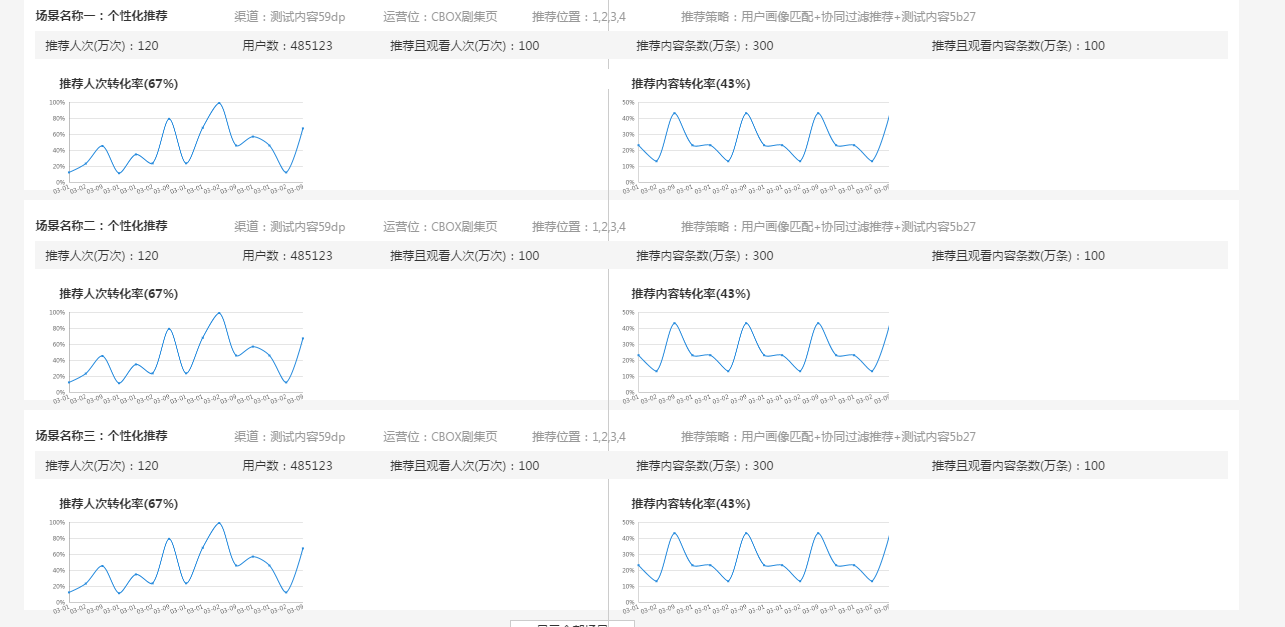
2.获取多个两个折线图,代码如下:
  1 import React, {PropTypes, Component} from 'react';
  2 import ECharts from 'react-echarts';
  3 import {Row,Col,Modal} from 'antd';
  4 import SceneConverRateModal from './SceneConverRateModal';
  5 import '../../../../common/sass/public/echarts.scss';
  6
  7 export default class SceneConverRate extends React.Component {
  8     constructor(props) {
  9         super(props);
 10         let d = new Date();
 11         //初始化修改状态属性
 12         this.state = {
 13             visible: false,
 14             queryParam: {
 15                 'activityId': this.props.evaluateData.activity.activityId,//活动ID
 16                 'statisDate': d.getFullYear() + "" + (d.getMonth() + 1) + "" + d.getDate(),//查询日期默认当天
 17                 'userType': 1,//用户类型:1是全部用户,2是注册用户
 18                 'channelId':null,//渠道ID
 19                 'operpId':null,//运营位ID
 20                 'rows':3,// 每页总条数据
 21                 'page':1//  当前页
 22             }
 23         }
 24     }
 25     //组件渲染之前调用方法获取数据
 26     componentDidMount() {
 27         //调用redux中action中的ajax方法,调用相对应的java的方法获取返回数据
 28         this.props.actions.sceneEvaluateRate(this.state.queryParam);
 29     }
 30     render() {
 31         const sceneEvaluateRateData = this.props.evaluateData.sceneEvaluateRateData.data;
 32         return (
 33             <div>
 34                     <h2 className="common-echart-title-mn">分场景转化率</h2>
 35                     {/*map方法循环获取echart折线图*/}
 36                     {
 37                         sceneEvaluateRateData.map((item, index) => {
 38                         return <div><EchartsCom item={item} index={index}></EchartsCom></div>
 39                     })
 40                     }
 41             </div>
 42         );
 43     }
 44
 45 }
 46
 47 //循环的组件EchartsCom
 48 const EchartsCom = (props) => {
 49     //提取返回数据中的每日的推荐人次转化率
 50     function userRateArr() {
 51         let userRateArr = new Array();
 52         props.item.recItemUsers.forEach(function (e, index) {
 53             userRateArr.push(e.userRate*100);
 54         });
 55         return userRateArr;
 56     }
 57
 58 //提取返回数据中的每日的推荐内容转化率
 59     function itemRateArr() {
 60         let itemRateArr = new Array();
 61         props.item.recItemUsers.forEach(function (e, index) {
 62             itemRateArr.push(e.itemRate*100);
 63         });
 64         return itemRateArr;
 65     }
 66     //推荐人次转化率和推荐内容转化率数组中的最后一个数据,在echart标题上()显示
 67     const userRateLast = (userRateArr()[(userRateArr().length-1)])?(userRateArr()[(userRateArr().length-1)]) +'%' :'没有数据';
 68     const itemRateLast = (itemRateArr()[itemRateArr().length-1])?(itemRateArr()[itemRateArr().length-1])+'%':'没有数据';
 69    //提取返回数据中的日期
 70     function dateArr() {
 71         let dateArr = new Array();
 72         props.item.recItemUsers.forEach(function (e, index) {
 73             dateArr.push(e.date.slice(4,6)+'-'+e.date.slice(6,8));
 74         });
 75         return dateArr;
 76     }
 77     //echart两个折线图渲染 方法
 78     function eachCom() {
 79         //推荐人次转化率折线图option设置
 80         const optionUsers = {
 81             tooltip: {
 82                 trigger: 'axis'
 83             },
 84             grid: {
 85                 left: '5%',
 86                 right: '5%',
 87                 top:'10px',
 88                 bottom: '5%',
 89                 containLabel: true
 90             },
 91             xAxis: [
 92                 {
 93                     type : 'category',
 94                     boundaryGap : false,
 95                     axisTick:{
 96                         show:false,//是否显示坐标轴刻度
 97                     },
 98                     /*设置X轴字体样式*/
 99                     axisLabel: {
100                         show: true,
101                         interval: 0,
102                         rotate: 20,//倾斜30度
103                         textStyle: {
104                             color: '#666',
105                             fontSize: 12,
106                             fontFamily: '微软雅黑'
107                         }
108                     },
109                     axisLine: {
110                         lineStyle:{
111                             color:'#999'
112                         }
113                     },
114                     data: dateArr()
115                 }
116             ],
117             yAxis: [
118                {
119                     type : 'value',
120                     axisTick:{
121                         show:false,//是否显示坐标轴刻度
122                     },
123                     //splitNumber:10,//增加Y轴刻度变多
124                     /*设置y轴字体样式*/
125                     axisLabel: {
126                         show: true,
127                         formatter: '{value}%',
128                         textStyle: {
129                             color: '#666',
130                             fontSize: 12,
131                             fontFamily: '微软雅黑'
132                         }
133                     },
134                     axisLine: {
135                         lineStyle:{
136                             color:'#999'
137                         }
138                     }
139                 }
140             ],
141             series: [
142                 {
143                     name: '推荐人次转化率',
144                     type: 'line',
145                     stack: '总量',
146                     symbol: 'star',//节点性状
147                     itemStyle: {
148                         normal: {
149                             color: "#278BDD" //图标颜色
150                         }
151                     },
152                     lineStyle: {
153                         normal: {
154                              2,  //连线粗细
155                             color: "#278BDD"  //连线颜色
156                         }
157                     },
158                     smooth: true,//折线图是趋缓的
159                     data: userRateArr()
160                 }
161             ]
162         };
163         //推荐内容转化率折线图option设置
164         const optionItems = {
165             tooltip: {
166                 trigger: 'axis'
167             },
168             grid: {
169                 left: '5%',
170                 right: '0',
171                 top:'10px',
172                 bottom: '5%',
173                 containLabel: true
174             },
175              xAxis: [
176                 {
177                     type : 'category',
178                     boundaryGap : false,
179                     axisTick:{
180                         show:false,//是否显示坐标轴刻度
181                     },
182                     /*设置X轴字体样式*/
183                     axisLabel: {
184                         show: true,
185                         interval: 0,
186                         rotate: 20,//倾斜30度
187                         textStyle: {
188                             color: '#666',
189                             fontSize: 12,
190                             fontFamily: '微软雅黑'
191                         }
192                     },
193                     axisLine: {
194                         lineStyle:{
195                             color:'#999'
196                         }
197                     },
198                     data: dateArr()
199                 }
200             ],
201             yAxis: [
202                {
203                     type : 'value',
204                     axisTick:{
205                         show:false,//是否显示坐标轴刻度
206                     },
207                     //splitNumber:10,//增加Y轴刻度变多
208                     /*设置y轴字体样式*/
209                     axisLabel: {
210                         show: true,
211                         formatter: '{value}%',
212                         textStyle: {
213                             color: '#666',
214                             fontSize: 12,
215                             fontFamily: '微软雅黑'
216                         }
217                     },
218                     axisLine: {
219                         lineStyle:{
220                             color:'#999'
221                         }
222                     }
223                 }
224             ],
225             series: [
226                 {
227                     name: '推荐内容转化率',
228                     type: 'line',
229                     stack: '总量',
230                     symbol: 'star',//节点性状
231                     itemStyle: {
232                         normal: {
233                             color: "#278BDD" //图标颜色
234                         }
235                     },
236                     lineStyle: {
237                         normal: {
238                              2,  //连线粗细
239                             color: "#278BDD"  //连线颜色
240                         }
241                     },
242                     smooth: true,//折线图是趋缓的
243                     data: itemRateArr()
244                 }
245             ]
246         };
247         if (props.item.recItemUsers.length !== 0) {
248             return<div className="common-echart-body-div">
249                      <Col span={12} className="commont-small-ehcharts">
250                             <Col span={14} offset={1}><h2 className="common-echart-title">推荐人次转化率({userRateLast})</h2></Col>
251                             <ECharts option={optionUsers} />
252                       </Col>
253                       <Col span={2} ><div className="common-echart-border"></div></Col>
254                       <Col span={12} className="commont-small-ehcharts">
255                       <Col span={14} offset={1}><h2 className="common-echart-title">推荐内容转化率({itemRateLast})</h2></Col>
256                             <ECharts option={optionItems} />
257                       </Col>
258                  </div>;
259         } else {
260             return '没有折线图';
261         }
262     }
263     return (
264         <div className="sceneEvaluateRate">
265           <Row>
266             <Col span={4} className="common-echart-title-mn">场景名称
267             {
268               (()=>{
269                 switch(props.index + 1){
270                     case 1:
271                             return "一";
272                         case 2:
273                             return "二";
274                         case 3:
275                             return "三";
276                         default:
277                             return props.index + 1;
278                 }
279               })()}:{props.item.sceneName}</Col>
280             <Col span={3} className="common-text-font">渠道:{props.item.channelName}</Col>
281             <Col span={3} className="common-text-font">运营位:{props.item.operatName}</Col>
282             <Col span={3} className="common-text-font">推荐位置:{props.item.recPosition}</Col>
283             <Col span={11} className="common-text-font">推荐策略:{props.item.strategyName}+{props.item.supplyStrategyName}</Col>
284             <Col span={24} className="common-text-bgcolor">
285                 <Col span={4} className="common-echart-title">推荐人次(万次):{props.item.recCount}</Col>
286                  <Col span={3} className="common-echart-title">用户数:{props.item.activityUserCnt}</Col>
287                 <Col span={5} className="common-echart-title">推荐且观看人次(万次):{props.item.recSeeUserCount}</Col>
288                 <Col span={6} className="common-echart-title">推荐内容条数(万条):{props.item.recItemCnt}</Col>
289                 <Col span={6} className="common-echart-title">推荐且观看内容条数(万条):{props.item.recSeeUserCount}</Col>
290             </Col>
291             {eachCom()}
292          </Row>
293         </div>
294     );
295 }
效果图如下:
只是大概的记录了一下,下一篇会记录饼图在react脚手架中的渲染。
可以转载,但请标明文章出处。若有帮助你,麻烦请你抬抬手指点击一下文章下方的“好文要顶”!