1、grid用于表示离容器上下左右的距离,可以使用数值,亦可使用百分比。
grid: {
     top: '65',
     right: '10%',//百分比
     left: '89',
     bottom: '60' //数值
},
2、tooltip
tooltip: {
    trigger: 'axis',//用于柱状图折线图等存在坐标轴的图表中。
    // trigger: 'item',//用于散点图、饼图等无类目轴的图表中

    //设置背景色,边框颜色、边框宽度
    backgroundColor: 'rgba(4, 10, 13, 0.6)',
    borderColor: '#48607f',
    borderWidth: 1,

    //设置悬浮显示的字体大小、颜色、字体
    textStyle: {
        fontSize: 16,
        color: '#eeeeef',
        fontFamily: 'PingFang-SC-Medium',
    },
    padding:[10,25],

    //设置当鼠标悬浮时,指示器的展示方式
    axisPointer: {
        //type:阴影指示器,通过shadowStyle设置阴影颜色及透明度。type类型shadow与shadowStyle想对应。
        //type可为line、shadow、none、cross
        type: "shadow",
        shadowStyle:{
          color:'rgba(173,190,223,0.15)',
        },
        label: {
          show: false
        }
    },
    //对于悬浮框中带有特殊样式的,可使用如下方式进行设置。
    formatter: function(params){
        let data1 = formatData(params[0].value);
        let data2 = formatData(params[1].value || 0);
        let data3 = bytesToSize(params[2].value || 0);
        let data4 = bytesToSize(params[3].value || 0);
        let res = params[0].name+`<br/>`+
          `<div style=" 10px;height: 10px;margin-right: 8px;background-color: #058cff;display: inline-block"></div>`+'数据总量:'+data4+`<br/>`+
          `<div style=" 10px;height: 10px;border-radius:5px;margin-right: 8px;background-color: #058cff;display: inline-block"></div>`+'数据总条数:'+data2+'条'+`<br/>`+
          `<div style=" 10px;height: 10px;margin-right: 8px;background-color: #10a474;display: inline-block"></div>`+'数据增量:'+data3+`<br/>`+
          `<div style=" 10px;height: 10px;border-radius:5px;margin-right: 8px;background-color: #10a474;display: inline-block"></div>`+'数据增加条数:'+data1+'条'
        return res;
    }
},
3、legend图例
legend: {
  type: 'scroll',//设置legend滚动条的出现
  orient: 'horizontal',//图例列表的布局朝向,横向还是纵向  vertical纵向,horizontal横向
  data:legends,//图例列表
  bottom:0,
  right:60,
   195,
  //图例标记大小样式设置
  icon: 'circle',
  itemWidth: 10,
  itemHeight: 10,
  itemGap:10,//图例之间的间隔(横向或纵向,根据orient来判断)
  textStyle: {
    color: '#fff',
    fontSize: 16,
    fontFamily: 'PingFang-SC-Medium',
    padding: [0,0,0,10],
    //rich可以自定义文本样式
    rich: {
        name: {
            fontSize: 17,
            fontFamily: 'PingFang',
            backgroundColor: 'rgba(1, 9, 23, 0)',
            borderRadius: 2,
            color: '#fff',
            // padding: [5, 10, 5, 6],
            //  52,
        },
        count: {
            fontSize: 17,
             58,
            align: 'right',
            color: '#fff',
            padding: [5, 0, 10, 0],
        }
    }
  },
  formatter: function (name) {
    const index = data.findIndex(item => item.name === name);
    const count =  data[index].value;
    const label = `{name|使用name样式}` + `{count|使用count样式}`;
    return label;
  },
},
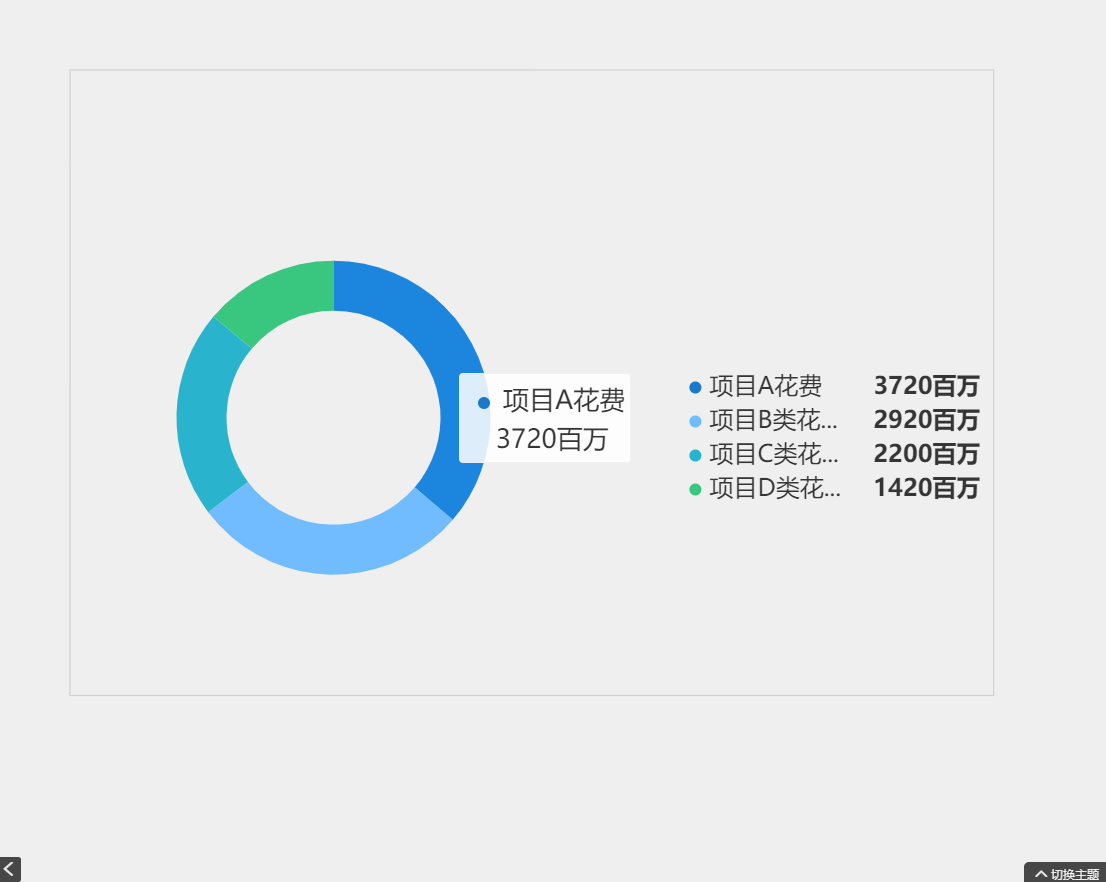
以下,我们将通过例子对上面的属性进行展示。首先以饼图为例,可将代码直接复制至https://www.makeapie.com/explore.html#sort=rank~timeframe=all~author=all 可直观感受效果。


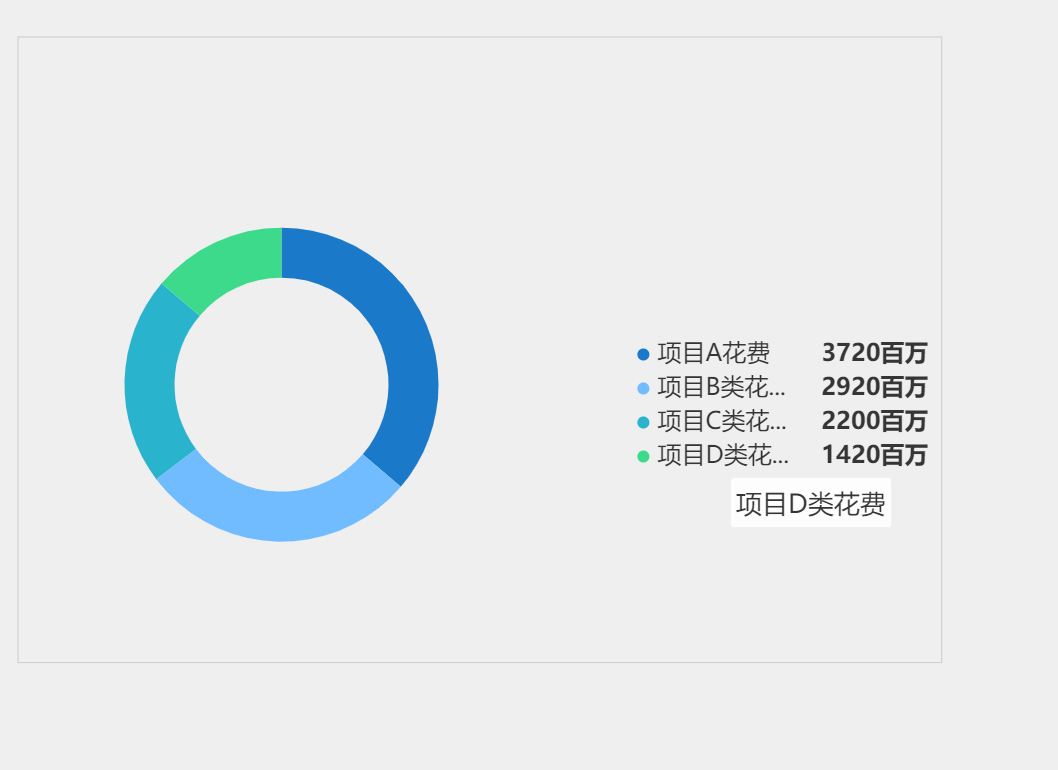
1 let color = ['#0E7CE2', '#FF8352', '#E271DE', '#F8456B', '#00FFFF', '#4AEAB0']; 2 let seriesData = [{ 3 name: "项目A花费", 4 value: "3720", 5 unit: "百万" 6 }, 7 { 8 name: "项目B类花费", 9 value: "2920", 10 unit: "百万" 11 }, 12 { 13 name: "项目C类花费", 14 value: "2200", 15 unit: "百万" 16 }, 17 { 18 name: "项目D类花费", 19 value: "1420", 20 unit: "百万" 21 } 22 ]; 23 24 25 26 let nameData = []; 27 seriesData.forEach((item) => { 28 nameData.push(item.name) 29 }); 30 31 option = { 32 grid:{ 33 show:true, 34 top:60, 35 bottom:'20%', 36 left:60, 37 right:'10%' 38 39 }, 40 backgroundColor: 'rgba(0,0,0,0)', 41 color: ['#1a79c9', '#71bcff', '#29b3cc', '#39c77f', '#f99b37', '#ef5150', '#f9db63'], 42 tooltip: { 43 trigger: 'item', 44 backgroundColor: 'rgba(255,255,255,0.85)', 45 borderWidth: 1, 46 borderColor:'rgba(238,238,238,0.85)', 47 // remToPx(230/75), 48 height:96, 49 marginTop:16, 50 marginLeft:13, 51 textStyle: { 52 fontSize: 26, 53 color: '#353535', 54 fontFamily: 'PingFang-SC-Medium', 55 }, 56 axisPointer:{ 57 type: 'none', 58 }, 59 formatter: function(params){ 60 return '<span style="display:inline-block;margin-left:13px;margin-right:13px;border-radius:10px;12px;height:12px;background-color:' + params.color + ';"></span>'+params.name + '<br/>' +' '+ params.value + params.data.unit 61 // return '{name|' + params.name + '}' + ' ' + '{name|' + (params.data.value/sum*100).toFixed(2)% + '}' 62 }, 63 }, 64 legend: { 65 orient: 'vertical', 66 icon: 'circle', 67 x: '61.7%', 68 y: 'center', 69 data: seriesData, 70 itemWidth: 12, 71 itemHeight: 12, 72 align: 'left', 73 //由于长度超出的使用…展示,故通过tooltip显示标签内容 74 tooltip:{ 75 show:true, 76 }, 77 textStyle: { 78 rich: { 79 name: { 80 align: 'left', 81 // 100, 82 170, 83 fontSize: 24, 84 color: '#353535', 85 padding: [0, 0, 0, 3], 86 fontFamily: 'PingFang-SC-Medium' 87 }, 88 value: { 89 align: 'right', 90 70, 91 fontSize: 24, 92 color: '#353535', 93 fontWeight: 'bold', 94 padding: [0, 90, 0, 24], 95 fontFamily: 'PingFang-SC-Medium' 96 }, 97 unit: { 98 fontSize: 24, 99 color: '#353535', 100 fontWeight: 'bold', 101 fontFamily: 'PingFang-SC-Medium' 102 }, 103 104 } 105 }, 106 formatter: function(name) { 107 let res = seriesData.filter(v => v.name === name); 108 res = res[0] || {}; 109 //标签长度大于5时隐藏 110 if(name.length>5){ 111 name = name.slice(0,5) + '...' 112 } 113 return '{name|' + name + '} {value|' + res.value + res.unit + '}' 114 } 115 }, 116 series: [{ 117 type: 'pie', 118 radius: [107, 157], 119 padding: [58, 84, 80, 65], 120 center: ['29.6%', '47.57%'], 121 data: seriesData, 122 hoverAnimation: false, 123 label: { 124 show: false, 125 }, 126 }] 127 };
结果如图所示:
折线图为例:
  1 let colorList = ['rgb(26, 121, 200)', 'rgb(57, 199, 127)', 'rgb(249, 155, 55)'];
  2 let colorStop = ['rgba(26, 121, 200, 0.2)', 'rgba(26, 121, 200, 0)', 'rgba(57, 199, 127, 0.2)', 'rgba(57, 199, 127, 0)', 'rgba(249, 155, 55, 0.2)', 'rgba(249, 155, 55, 0)'];
  3 // console.log('aaa' ,colorStop);
  4 let series = [];
  5 let data = {
  6     data: [6.5, 19.6, -4.6, 5.2],
  7     name: "标题",
  8     stack: null,
  9     type: "line",
 10     xaxis: ["**制造业", "*******制造业", "******制造业", "**********制造业"],
 11     yaxis: ["%"]
 12 }
 13
 14
 15 series.push({
 16     name: data.name,
 17     type: 'line',
 18     symbol: 'emptyCircle',
 19     // showSymbol: !data.series[i].closeSymbolShow,
 20     symbolSize: 0,
 21     data: data.data,
 22     lineStyle: {
 23         type: 'solid',
 24          3,
 25     },
 26     areaStyle: {
 27         color: {
 28             type: 'linear',
 29             x: 0,
 30             y: 0,
 31             x2: 0,
 32             y2: 1,
 33             colorStops: [{
 34                 offset: 0,
 35                 color: colorStop[0] // 0% 处的颜色
 36             }, {
 37                 offset: 1,
 38                 color: colorStop[1], // 100% 处的颜色
 39             }],
 40             // opacity: 0.2,
 41             global: false // 缺省为 false
 42         }
 43     }
 44 })
 45
 46 let paddingTop = '-20';
 47 option = {
 48     backgroundColor: 'rgba(0, 0, 0, 0)',
 49     color: colorList,
 50     grid: {
 51         left: 20,
 52         right: 40,
 53         top: 114,
 54         bottom: 65,
 55         containLabel: true
 56     },
 57     legend: {
 58         textStyle: {
 59             color: "#000",
 60             fontSize: 20,
 61             fontFamily: 'PingFang-SC-Medium',
 62             padding: [0, 0, 0, 5]
 63         },
 64         itemGap: 6,
 65         show: false,
 66         itemHeight: 14,
 67         itemWidth: 30,
 68         right: '5%',
 69         top: '13%',
 70         // icon: "circle",
 71         data: data.legends,
 72     },
 73     tooltip: {
 74         trigger: 'axis',
 75         backgroundColor: 'rgba(9, 20, 37, 0.75)',
 76         borderColor: '#48607f',
 77         borderWidth: 1,
 78         textStyle: {
 79             fontSize: 18,
 80             color: '#fff',
 81             align: 'left',
 82             fontFamily: 'PingFang-SC-Medium',
 83         },
 84         padding: [10, 25],
 85         axisPointer: {
 86             // type: 'line',
 87             type:'shadow',
 88             label: {
 89                 show: false,
 90                 backgroundColor: '#333'
 91             }
 92         }
 93     },
 94     xAxis: {
 95         show: true,
 96         triggerEvent: true,
 97         type: 'category',
 98         nameGap: 15,
 99         axisTick: {
100             show: false,
101         },
102         //存在负数时,使用横线区分正负
103         axisLine: {
104             show: true,
105             lineStyle: {
106                 color: '#F02934',
107                  1,
108                 type: "dashed"
109             }
110         },
111         splitLine: {
112             //竖线是否显示show,若显示,则通过lineStyle设置颜色,线的类型,宽度
113             show: true,
114             lineStyle: {
115                 color: '#e1e1e1',
116                 type: "solid",
117                 // type: "dashed",
118                  1,
119             }
120         },
121         axisLabel: {
122             rotate: 30,
123             margin: 60,
124             //判断横坐标名称的长度,长度超过固定值,超出部分进行换行处理。
125             formatter: function(value) {
126                 var res = '';
127                 if (value.length > 7) {
128                     res = value.substring(0, 7) + '
' + value.substring(7);
129                 } else {
130                     res = value;
131                 }
132                 return res;
133             },
134             textStyle: {
135                 fontSize: 22,
136                 fontFamily: 'PingFang-SC-Medium',
137                 // padding: [remToPx(20/75), 0, 0, 0],
138
139                 align: "center",
140                 __verticalAlign: 'middle',
141                 color: '#838383'
142             },
143         },
144         data: data.xaxis
145     },
146     yAxis: {
147         show: true,
148         name: data.yaxis,
149         nameTextStyle: {
150             fontSize: 22,
151             fontFamily: 'PingFang-SC-Medium',
152             color: '#838383'
153         },
154         type: 'value',
155         axisTick: {
156             show: false
157         },
158         axisLine: {
159             show: false,
160             lineStyle: {
161                  1,
162                 color: '#aaa',
163             }
164         },
165         splitLine: {
166             show: true,
167             lineStyle: {
168                  1,
169                 // type: "dashed",
170                 type:"solid",
171                 color: '#e1e1e1'
172             }
173         },
174         axisLabel: {
175             textStyle: {
176                 fontSize: 22,
177                 fontFamily: 'PingFang-SC-Medium',
178                 color: '#838383'
179             }
180         }
181     },
182     series: series
183 };
