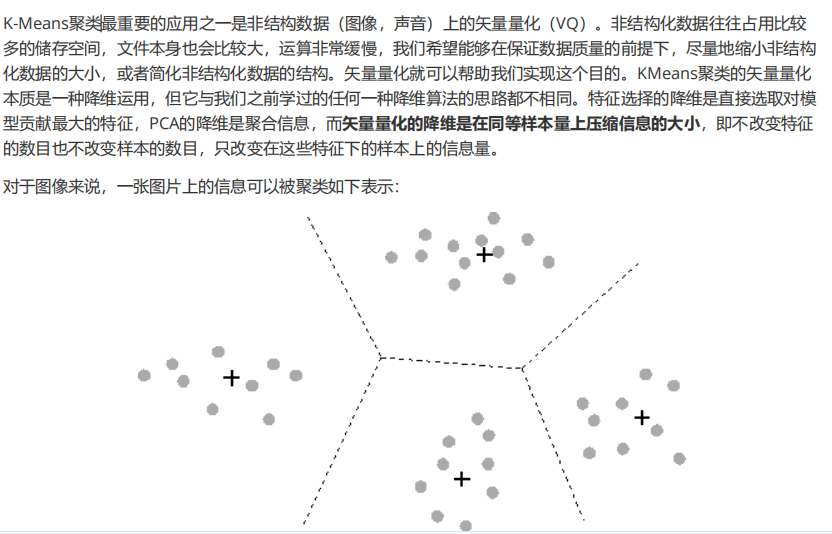
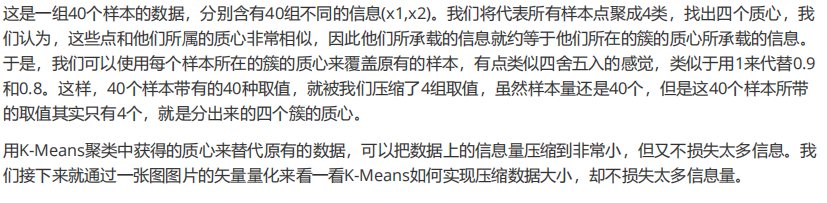
1. 导入需要的库
import numpy as np
import matplotlib.pyplot as plt
from sklearn.cluster import KMeans
from sklearn.metrics import pairwise_distances_argmin
from sklearn.datasets import load_sample_image
from sklearn.utils import shuffle
2. 导入数据,探索数据
china = load_sample_image("china.jpg")
china
china.dtype
china.shape
china[0][0]
newimage = china.reshape((427 * 640,3))
import pandas as pd
pd.DataFrame(newimage).drop_duplicates().shape
plt.figure(figsize=(15,15))
plt.imshow(china)
flower = load_sample_image("flower.jpg")
plt.figure(figsize=(15,15))
plt.imshow(flower)
图像探索完毕,我们了解了,图像现在有9W多种颜色。我们希望来试试看,能否使用K-Means将颜色压缩到64种,还不严重损耗图像的质量。为此,我们要使用K-Means来将9W种颜色聚类成64类,然后使用64个簇的质心来替代全部的9W种颜色,记得质心有着这样的性质:簇中的点都是离质心最近的样本点。
为了比较,我们还要画出随机压缩到64种颜色的矢量量化图像。我们需要随机选取64个样本点作为随机质心,计算原数据中每个样本到它们的距离来找出离每个样本最近的随机质心,然后用每个样本所对应的随机质心来替换原本的样本。两种状况下,我们观察图像可视化之后的状况,以查看图片信息的损失。
在这之前,我们需要把数据处理成sklearn中的K-Means类能够接受的数据。
3. 决定超参数,数据预处理
n_clusters = 64
china = np.array(china, dtype=np.float64) / china.max()
w, h, d = original_shape = tuple(china.shape)
assert d == 3
image_array = np.reshape(china, (w * h, d))

china = np.array(china, dtype=np.float64) / china.max()

w, h, d = original_shape = tuple(china.shape)
w
h
d

assert d == 3
d_ = 5
assert d_ == 3, "一个格子中的特征数目不等于3种"
image_array = np.reshape(china, (w * h, d))
image_array

image_array.shape
a = np.random.random((2,4))
a
a.reshape((4,2))
np.reshape(a,(4,2))
np.reshape(a,(2,2,2))
np.reshape(a,(3,2))
4. 对数据进行K-Means的矢量量化
image_array_sample = shuffle(image_array, random_state=0)[:1000]
kmeans = KMeans(n_clusters=n_clusters, random_state=0).fit(image_array_sample)
kmeans.cluster_centers_

labels = kmeans.predict(image_array)
labels.shape

image_kmeans = image_array.copy()
for i in range(w*h):
    image_kmeans[i] = kmeans.cluster_centers_[labels[i]]

image_kmeans
pd.DataFrame(image_kmeans).drop_duplicates().shape

image_kmeans = image_kmeans.reshape(w,h,d)
image_kmeans.shape
5. 对数据进行随机的矢量量化
centroid_random = shuffle(image_array, random_state=0)[:n_clusters]
labels_random = pairwise_distances_argmin(centroid_random,image_array,axis=0)
labels_random.shape
len(set(labels_random))
image_random = image_array.copy()
for i in range(w*h):
    image_random[i] = centroid_random[labels_random[i]]
image_random = image_random.reshape(w,h,d)
image_random.shape
6. 将原图,按KMeans矢量量化和随机矢量量化的图像绘制出来
plt.figure(figsize=(10,10))
plt.axis('off')
plt.title('Original image (96,615 colors)')
plt.imshow(china)
plt.figure(figsize=(10,10))
plt.axis('off')
plt.title('Quantized image (64 colors, K-Means)')
plt.imshow(image_kmeans)
plt.figure(figsize=(10,10))
plt.axis('off')
plt.title('Quantized image (64 colors, Random)')
plt.imshow(image_random)
plt.show()