前言:
做运维的很重要的基础工作就是监控,之前都是统计数据入库,然后前端js图表插件出图,费时费力,可定制性差
前几天接触到了ELK(logstash, elasticsearch, kibana)这套日志收集展示工具集,的确很方便,但是手头没有那么大的存储啊
也不是所有的日志数据都需要,然后就发现了grafana + influxdb的解决方案
简介:
先给出这两个工具的官网
http://grafana.org/
http://influxdb.com/
建议各位看官先大体浏览下这两个工具的介绍和文档
grafana是前端展示界面,要放到apache或nginx下,不需要php环境奥
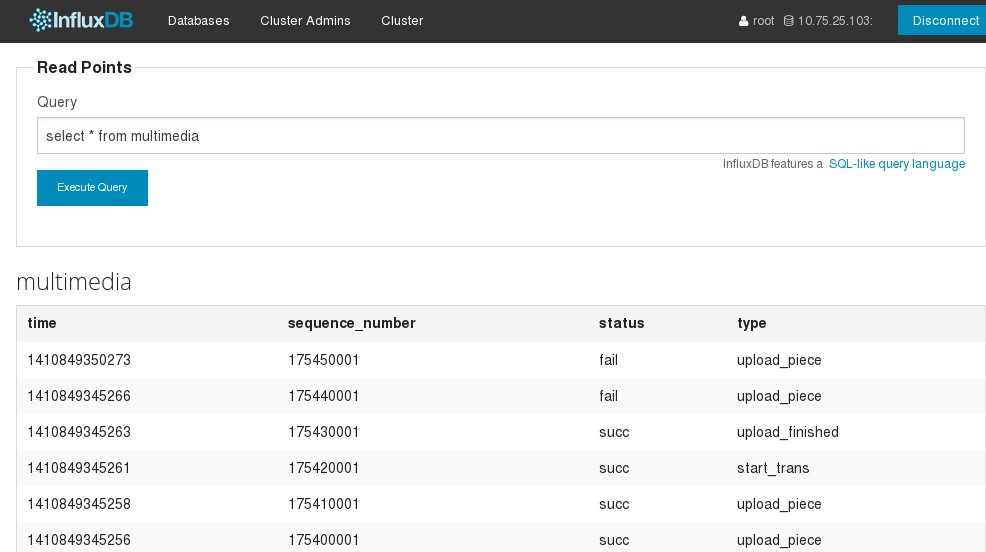
influxdb是一个时间序列的数据库,你插入的每条数据会自动附加上两个字段,一个时间,一个序列号(用来作为主键的)
ps: influxdb的0.8版本不支持centos 5,只能是centos6以上,所以centos5的还是用0.7的版本
安装:
influxdb就一个rpm包,没有其他依赖,是用go语言写的,go发展很迅猛啊
influxdb会监听4个端口
tcp 0 0 0.0.0.0:8099 0.0.0.0:* LISTEN 29458/influxdb
tcp 0 0 0.0.0.0:8083 0.0.0.0:* LISTEN 29458/influxdb
tcp 0 0 0.0.0.0:8086 0.0.0.0:* LISTEN 29458/influxdb
tcp 0 0 0.0.0.0:8090 0.0.0.0:* LISTEN 29458/influxdb
其中单机使用只需要用到两个,另外两个是分布式部署时采用的
8083 web管理端 http://ip:8083 用户名和密码都是 root
8086 api接口调用端
配置
grafana配置
重命名配置文件
mv config-sample.js config.js
|
1
2
3
4
5
6
7
8
9
10
11
12
13
14
15
16
|
// InfluxDB example setup (the InfluxDB databases specified need to exist)datasources: { influxdb: { type: 'influxdb', username: 'root', password: 'root', }, grafana: { type: 'influxdb', username: 'root', password: 'root', grafanaDB: true },}, |
这里配置了两个数据源,第一个是你要存储的监控数据,第二个是grafana用的
当然了你需要提前在influxdb的界面里建立好这两个库(这里就不演示influxdb web界面的登陆和建库操作了)
现在浏览器打开grafana
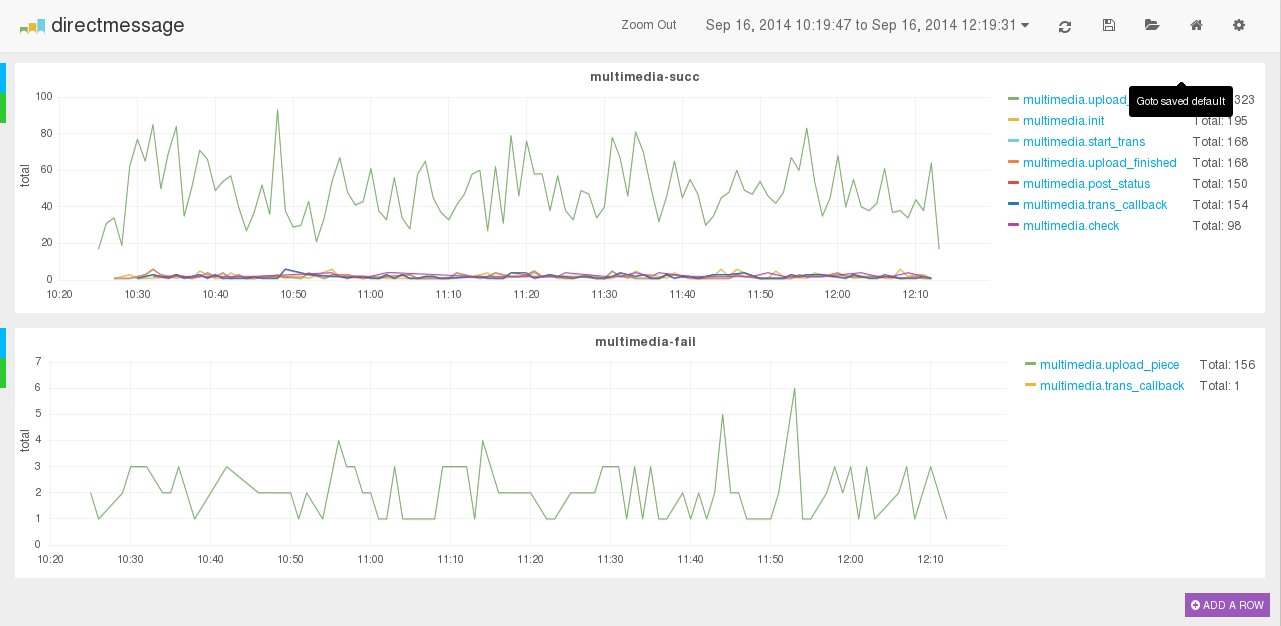
这个界面是我配置好的,你看到的样子是黑色的官网上那个样子,界面自带黑白两个主题

为了便于理解grafana的配置方法
这里要说明一下收集数据的过程,我用的python收集

从日志中收集了两个字段 status和type
python脚本如下
|
1
2
3
4
5
6
7
8
9
10
11
12
13
14
15
16
17
18
19
20
21
22
23
24
25
26
27
28
29
30
31
32
33
34
35
|
#!/usr/bin/python# push log to influxdb on 10.75.25.103import timefrom influxdb import client as influxdbhost = '10.75.25.103'port = 8086username = 'root'password = 'root'database = 'directmessage'db = influxdb.InfluxDBClient(host, port, username, password, database)log_fn = '/data1/multimedia/logs/scribe.log'f = open(log_fn)f.seek(0,2)while True: line = f.readline() try: lines = line.split(' ') post_data=[("name","multimedia"),("columns" ,["status", "type"]),("points",[[lines[5], lines[6]]])] data = [ {"name":"multimedia", "columns" : ["status", "type"], "points" : [[lines[5], lines[6]]] } ] db.write_points(data) except: f.close() f = open(log_fn) f.seek(0,2) time.sleep(5) |
influxdb提供了python的模块,用pip安装即可,如果不觉得麻烦也可以用shell的curl
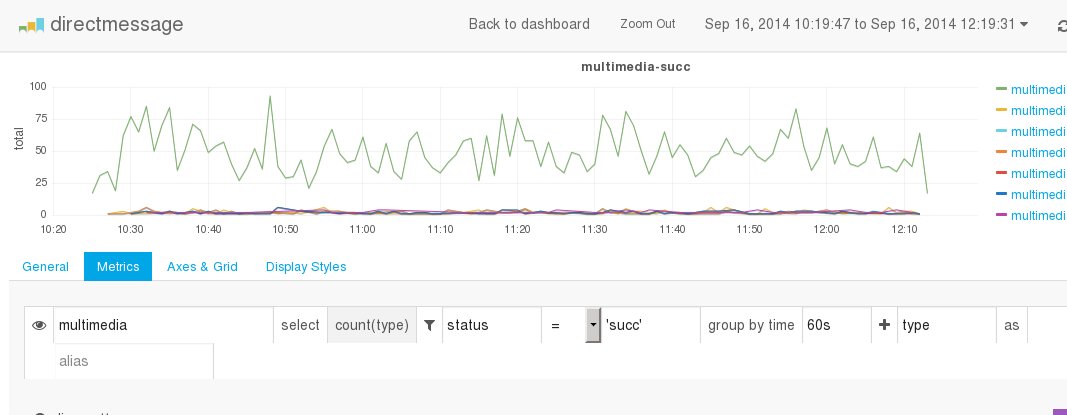
下面是grafana最主要的配置项,其余自己摸索下就可以了

如果grafana的config.js配置没问题,点击输入框会自动提示字段的
这里就相当于你要展示那些字段,类似sql语法
第一个multimedia是python脚本中的name,相当于mysql中的表
select后面的 count(type) 是你要在图表中展示那些数据
后面的漏斗相当于 sql的where status = ‘succ'
group by time 60s 相当于你用cron一分钟收集一次数据
后面的type 就是 group by type
好了其余都是页面展示的微调。
收工。