逻辑斯蒂回归
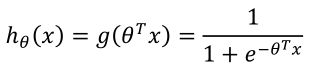
对于目标值是离散变量的两类分类问题,假设目标值为{0,1},所以先改变模型使其预测值在[0,1]之间,我们选择这样一个函数:
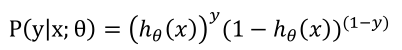
分类概率值:
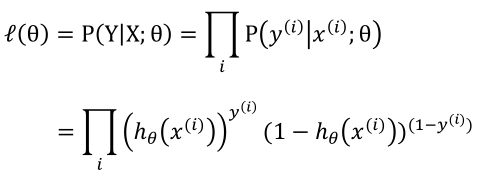
似然函数:
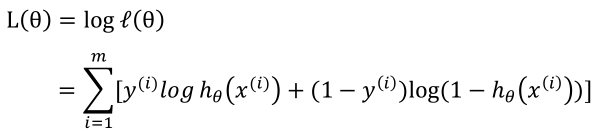
对数似然函数:
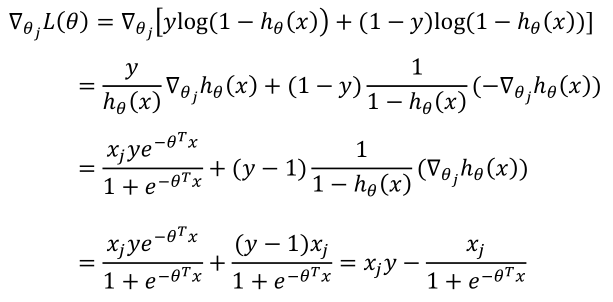

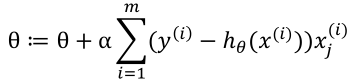
更新规则:
 1  # coding:utf-8
 2 import matplotlib.pyplot as plt
 3 import numpy as np
 4
 5 def dataN(length):#生成数据
 6     x = np.ones(shape = (length,3))
 7     y = np.zeros(length)
 8     for i in np.arange(0,length/100,0.02):
 9         x[100*i][1]=i
10         x[100*i][2]=i + 1 + np.random.uniform(0,1.2)
11         y[100*i]=1
12         x[100*i+1][1]=i+0.01
13         x[100*i+1][2]=i+0.01 + np.random.uniform(0,1.2)
14     return np.mat(x),np.mat(y).T
15
16 def sigmoid(x): #simoid 函数
17     return 1.0/(1+np.exp(-x))
18
19 def alphA(x,y): #选取前20次迭代cost最小的alpha
20     c=float("inf")
21     for k in range(1,1000):
22             a=1.0/k**3
23             f=gD(x,y,20,a)[1][-1]
24             if f>c:
25                 break
26             c=f
27             alpha=a
28     return alpha
29
30 def gD(x,y,iter,alpha):#梯度下降
31     theta=np.ones((3,1))
32
33     cost=[]
34     for i in range(iter):
35         hypothesis =sigmoid(np.dot(x,theta))
36         loss = hypothesis-y
37         cost.append(np.sum(loss[0]**2))
38         gradient = np.dot(x.transpose(),loss)
39         theta = theta -alpha * gradient
40     return theta,cost
41
42 def tesT(theta, x, y):#准确率
43     length=len(x)
44     count=0
45     for i in xrange(length):
46         predict = sigmoid(x[i, :] * theta)[0, 0] > 0.5
47         if predict == bool(y[i, 0]):
48             count+= 1
49     accuracy = float(count)/length
50     return accuracy
51
52 length=200
53 iter=1000
54 x,y=dataN(length)
55 theta,cost=gD(x,y,iter,alphA(x,y))
56 print tesT(theta, x, y) #0.92
57
58 plt.figure(1)
59 plt.plot(range(iter),cost)
60 plt.figure(2)
61 color=['or','ob']
62 for i in xrange(length):
63     plt.plot(x[i, 1], x[i, 2],color[int(y[i])])
64 theta = theta.getA()
65 plt.plot([0,length/100],[-theta[0],-theta[0]-theta[1]*length/100]/theta[2])
66 plt.show()

