本文转自Rancher Labs
介 绍
Prometheus高可用的必要性
在过去的几年里,Kubernetes的采用量增长了数倍。很明显,Kubernetes是容器编排的不二选择。与此同时,Prometheus也被认为是监控容器化和非容器化工作负载的绝佳选择。监控是任何基础设施的一个重要关注点,我们应该确保我们的监控设置具有高可用性和高可扩展性,以满足不断增长的基础设施的需求,特别是在采用Kubernetes的情况下。
因此,今天我们将部署一个集群化的Prometheus设置,它不仅能够弹性应对节点故障,还能保证合适的数据存档,供以后参考。我们的设置还具有很强的可扩展性,以至于我们可以在同一个监控保护伞下跨越多个Kubernetes集群。
当前方案
大部分的Prometheus部署都是使用持久卷的pod,而Prometheus则是使用联邦机制进行扩展。但是并不是所有的数据都可以使用联邦机制进行聚合,在这里,当你增加额外的服务器时,你往往需要一个机制来管理Prometheus配置。
解决方法
Thanos旨在解决上述问题。在Thanos的帮助下,我们不仅可以对Prometheus的实例进行多重复制,并在它们之间进行数据去重,还可以将数据归档到GCS或S3等长期存储中。
实施过程
Thanos 架构
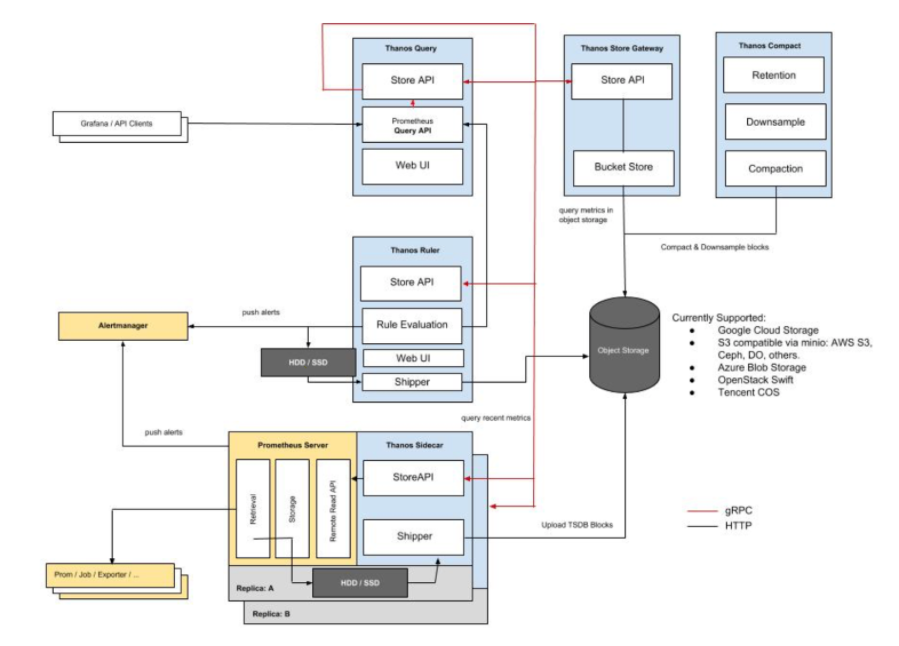
图片来源: https://thanos.io/quick-tutorial.md/
Thanos由以下组件构成:
-
Thanos sidecar:这是运行在Prometheus上的主要组件。它读取和归档对象存储上的数据。此外,它还管理着Prometheus的配置和生命周期。为了区分每个Prometheus实例,sidecar组件将外部标签注入到Prometheus配置中。该组件能够在 Prometheus 服务器的 PromQL 接口上运行查询。Sidecar组件还能监听Thanos gRPC协议,并在gRPC和REST之间翻译查询。
-
Thanos 存储:该组件在对象storage bucket中的历史数据之上实现了Store API,它主要作为API网关,因此不需要大量的本地磁盘空间。它在启动时加入一个Thanos集群,并公布它可以访问的数据。它在本地磁盘上保存了少量关于所有远程区块的信息,并使其与 bucket 保持同步。通常情况下,在重新启动时可以安全地删除此数据,但会增加启动时间。
-
Thanos查询:查询组件在HTTP上监听并将查询翻译成Thanos gRPC格式。它从不同的源头汇总查询结果,并能从Sidecar和Store读取数据。在HA设置中,它甚至会对查询结果进行重复数据删除。
HA组的运行时重复数据删除
Prometheus是有状态的,不允许复制其数据库。这意味着通过运行多个Prometheus副本来提高高可用性并不易于使用。简单的负载均衡是行不通的,比如在发生某些崩溃之后,一个副本可能会启动,但是查询这样的副本会导致它在关闭期间出现一个小的缺口(gap)。你有第二个副本可能正在启动,但它可能在另一个时刻(如滚动重启)关闭,因此在这些副本上面的负载均衡将无法正常工作。
-
Thanos Querier则从两个副本中提取数据,并对这些信号进行重复数据删除,从而为Querier使用者填补了缺口(gap)。
-
Thanos Compact组件将Prometheus 2.0存储引擎的压实程序应用于对象存储中的块数据存储。它通常不是语义上的并发安全,必须针对bucket 进行单例部署。它还负责数据的下采样——40小时后执行5m下采样,10天后执行1h下采样。
-
Thanos Ruler基本上和Prometheus的规则具有相同作用,唯一区别是它可以与Thanos组件进行通信。
配 置
前期准备
要完全理解这个教程,需要准备以下东西:
-
对Kubernetes和使用kubectl有一定的了解。
-
运行中的Kubernetes集群至少有3个节点(在本demo中,使用GKE集群)
-
实现Ingress Controller和Ingress对象(在本demo中使用Nginx Ingress Controller)。虽然这不是强制性的,但为了减少创建外部端点的数量,强烈建议使用。
-
创建用于Thanos组件访问对象存储的凭证(在本例中为GCS bucket)。
-
创建2个GCS bucket,并将其命名为Prometheus-long-term和thanos-ruler。
-
创建一个服务账户,角色为Storage Object Admin。
-
下载密钥文件作为json证书,并命名为thanos-gcs-credentials.json。
-
使用凭证创建Kubernetes sercret
kubectl create secret generic thanos-gcs-credentials --from-file=thanos-gcs-credentials.json
部署各类组件
部署Prometheus服务账户、Clusterroler和Clusterrolebinding
apiVersion: v1
kind: Namespace
metadata:
  name: monitoring
---
apiVersion: v1
kind: ServiceAccount
metadata:
  name: monitoring
  namespace: monitoring
---
apiVersion: rbac.authorization.k8s.io/v1beta1
kind: ClusterRole
metadata:
  name: monitoring
  namespace: monitoring
rules:
- apiGroups: [""]
  resources:
  - nodes
  - nodes/proxy
  - services
  - endpoints
  - pods
  verbs: ["get", "list", "watch"]
- apiGroups: [""]
  resources:
  - configmaps
  verbs: ["get"]
- nonResourceURLs: ["/metrics"]
  verbs: ["get"]
---
apiVersion: rbac.authorization.k8s.io/v1beta1
kind: ClusterRoleBinding
metadata:
  name: monitoring
subjects:
  - kind: ServiceAccount
    name: monitoring
    namespace: monitoring
roleRef:
  kind: ClusterRole
  Name: monitoring
  apiGroup: rbac.authorization.k8s.io
---
以上manifest创建了Prometheus所需的监控命名空间以及服务账户、clusterrole以及clusterrolebinding。
部署Prometheues配置configmap
apiVersion: v1
kind: ConfigMap
metadata:
  name: prometheus-server-conf
  labels:
    name: prometheus-server-conf
  namespace: monitoring
data:
  prometheus.yaml.tmpl: |-
    global:
      scrape_interval: 5s
      evaluation_interval: 5s
      external_labels:
        cluster: prometheus-ha
        # Each Prometheus has to have unique labels.
        replica: $(POD_NAME)

    rule_files:
      - /etc/prometheus/rules/*rules.yaml

    alerting:

      # We want our alerts to be deduplicated
      # from different replicas.
      alert_relabel_configs:
      - regex: replica
        action: labeldrop

      alertmanagers:
        - scheme: http
          path_prefix: /
          static_configs:
            - targets: ['alertmanager:9093']

    scrape_configs:
    - job_name: kubernetes-nodes-cadvisor
      scrape_interval: 10s
      scrape_timeout: 10s
      scheme: https
      tls_config:
        ca_file: /var/run/secrets/kubernetes.io/serviceaccount/ca.crt
      bearer_token_file: /var/run/secrets/kubernetes.io/serviceaccount/token
      kubernetes_sd_configs:
        - role: node
      relabel_configs:
        - action: labelmap
          regex: __meta_kubernetes_node_label_(.+)
        # Only for Kubernetes ^1.7.3.
        # See: https://github.com/prometheus/prometheus/issues/2916
        - target_label: __address__
          replacement: kubernetes.default.svc:443
        - source_labels: [__meta_kubernetes_node_name]
          regex: (.+)
          target_label: __metrics_path__
          replacement: /api/v1/nodes/${1}/proxy/metrics/cadvisor
      metric_relabel_configs:
        - action: replace
          source_labels: [id]
          regex: '^/machine.slice/machine-rkt\x2d([^\]+)\.+/([^/]+).service$'
          target_label: rkt_container_name
          replacement: '${2}-${1}'
        - action: replace
          source_labels: [id]
          regex: '^/system.slice/(.+).service$'
          target_label: systemd_service_name
          replacement: '${1}'

    - job_name: 'kubernetes-pods'
      kubernetes_sd_configs:
        - role: pod
      relabel_configs:
        - action: labelmap
          regex: __meta_kubernetes_pod_label_(.+)
        - source_labels: [__meta_kubernetes_namespace]
          action: replace
          target_label: kubernetes_namespace
        - source_labels: [__meta_kubernetes_pod_name]
          action: replace
          target_label: kubernetes_pod_name
        - source_labels: [__meta_kubernetes_pod_annotation_prometheus_io_scrape]
          action: keep
          regex: true
        - source_labels: [__meta_kubernetes_pod_annotation_prometheus_io_scheme]
          action: replace
          target_label: __scheme__
          regex: (https?)
        - source_labels: [__meta_kubernetes_pod_annotation_prometheus_io_path]
          action: replace
          target_label: __metrics_path__
          regex: (.+)
        - source_labels: [__address__, __meta_kubernetes_pod_prometheus_io_port]
          action: replace
          target_label: __address__
          regex: ([^:]+)(?::d+)?;(d+)
          replacement: $1:$2


    - job_name: 'kubernetes-apiservers'
      kubernetes_sd_configs:
        - role: endpoints
      scheme: https
      tls_config:
        ca_file: /var/run/secrets/kubernetes.io/serviceaccount/ca.crt
      bearer_token_file: /var/run/secrets/kubernetes.io/serviceaccount/token
      relabel_configs:
        - source_labels: [__meta_kubernetes_namespace, __meta_kubernetes_service_name, __meta_kubernetes_endpoint_port_name]
          action: keep
          regex: default;kubernetes;https

    - job_name: 'kubernetes-service-endpoints'
      kubernetes_sd_configs:
        - role: endpoints
      relabel_configs:
        - action: labelmap
          regex: __meta_kubernetes_service_label_(.+)
        - source_labels: [__meta_kubernetes_namespace]
          action: replace
          target_label: kubernetes_namespace
        - source_labels: [__meta_kubernetes_service_name]
          action: replace
          target_label: kubernetes_name
        - source_labels: [__meta_kubernetes_service_annotation_prometheus_io_scrape]
          action: keep
          regex: true
        - source_labels: [__meta_kubernetes_service_annotation_prometheus_io_scheme]
          action: replace
          target_label: __scheme__
          regex: (https?)
        - source_labels: [__meta_kubernetes_service_annotation_prometheus_io_path]
          action: replace
          target_label: __metrics_path__
          regex: (.+)
        - source_labels: [__address__, __meta_kubernetes_service_annotation_prometheus_io_port]
          action: replace
          target_label: __address__
          regex: (.+)(?::d+);(d+)
          replacement: $1:$2
上述Configmap创建了Prometheus配置文件模板。这个配置文件模板将被Thanos sidecar组件读取,它将生成实际的配置文件,而这个配置文件又将被运行在同一个pod中的Prometheus容器所消耗。在配置文件中添加external_labels部分是极其重要的,这样Querier就可以根据这个来重复删除数据。
部署Prometheus Rules configmap
这将创建我们的告警规则,这些规则将被转发到alertmanager,以便发送。
apiVersion: v1
kind: ConfigMap
metadata:
  name: prometheus-rules
  labels:
    name: prometheus-rules
  namespace: monitoring
data:
  alert-rules.yaml: |-
    groups:
      - name: Deployment
        rules:
        - alert: Deployment at 0 Replicas
          annotations:
            summary: Deployment {{$labels.deployment}} in {{$labels.namespace}} is currently having no pods running
          expr: |
            sum(kube_deployment_status_replicas{pod_template_hash=""}) by (deployment,namespace)  < 1
          for: 1m
          labels:
            team: devops

        - alert: HPA Scaling Limited
          annotations:
            summary: HPA named {{$labels.hpa}} in {{$labels.namespace}} namespace has reached scaling limited state
          expr: |
            (sum(kube_hpa_status_condition{condition="ScalingLimited",status="true"}) by (hpa,namespace)) == 1
          for: 1m
          labels:
            team: devops

        - alert: HPA at MaxCapacity
          annotations:
            summary: HPA named {{$labels.hpa}} in {{$labels.namespace}} namespace is running at Max Capacity
          expr: |
            ((sum(kube_hpa_spec_max_replicas) by (hpa,namespace)) - (sum(kube_hpa_status_current_replicas) by (hpa,namespace))) == 0
          for: 1m
          labels:
            team: devops

      - name: Pods
        rules:
        - alert: Container restarted
          annotations:
            summary: Container named {{$labels.container}} in {{$labels.pod}} in {{$labels.namespace}} was restarted
          expr: |
            sum(increase(kube_pod_container_status_restarts_total{namespace!="kube-system",pod_template_hash=""}[1m])) by (pod,namespace,container) > 0
          for: 0m
          labels:
            team: dev

        - alert: High Memory Usage of Container
          annotations:
            summary: Container named {{$labels.container}} in {{$labels.pod}} in {{$labels.namespace}} is using more than 75% of Memory Limit
          expr: |
            ((( sum(container_memory_usage_bytes{image!="",container_name!="POD", namespace!="kube-system"}) by (namespace,container_name,pod_name)  / sum(container_spec_memory_limit_bytes{image!="",container_name!="POD",namespace!="kube-system"}) by (namespace,container_name,pod_name) ) * 100 ) < +Inf ) > 75
          for: 5m
          labels:
            team: dev

        - alert: High CPU Usage of Container
          annotations:
            summary: Container named {{$labels.container}} in {{$labels.pod}} in {{$labels.namespace}} is using more than 75% of CPU Limit
          expr: |
            ((sum(irate(container_cpu_usage_seconds_total{image!="",container_name!="POD", namespace!="kube-system"}[30s])) by (namespace,container_name,pod_name) / sum(container_spec_cpu_quota{image!="",container_name!="POD", namespace!="kube-system"} / container_spec_cpu_period{image!="",container_name!="POD", namespace!="kube-system"}) by (namespace,container_name,pod_name) ) * 100)  > 75
          for: 5m
          labels:
            team: dev

      - name: Nodes
        rules:
        - alert: High Node Memory Usage
          annotations:
            summary: Node {{$labels.kubernetes_io_hostname}} has more than 80% memory used. Plan Capcity
          expr: |
            (sum (container_memory_working_set_bytes{id="/",container_name!="POD"}) by (kubernetes_io_hostname) / sum (machine_memory_bytes{}) by (kubernetes_io_hostname) * 100) > 80
          for: 5m
          labels:
            team: devops

        - alert: High Node CPU Usage
          annotations:
            summary: Node {{$labels.kubernetes_io_hostname}} has more than 80% allocatable cpu used. Plan Capacity.
          expr: |
            (sum(rate(container_cpu_usage_seconds_total{id="/", container_name!="POD"}[1m])) by (kubernetes_io_hostname) / sum(machine_cpu_cores) by (kubernetes_io_hostname)  * 100) > 80
          for: 5m
          labels:
            team: devops

        - alert: High Node Disk Usage
          annotations:
            summary: Node {{$labels.kubernetes_io_hostname}} has more than 85% disk used. Plan Capacity.
          expr: |
            (sum(container_fs_usage_bytes{device=~"^/dev/[sv]d[a-z][1-9]$",id="/",container_name!="POD"}) by (kubernetes_io_hostname) / sum(container_fs_limit_bytes{container_name!="POD",device=~"^/dev/[sv]d[a-z][1-9]$",id="/"}) by (kubernetes_io_hostname)) * 100 > 85
          for: 5m
          labels:
            team: devops
部署Prometheus Stateful Set
apiVersion: storage.k8s.io/v1beta1
kind: StorageClass
metadata:
  name: fast
  namespace: monitoring
provisioner: kubernetes.io/gce-pd
allowVolumeExpansion: true
---
apiVersion: apps/v1beta1
kind: StatefulSet
metadata:
  name: prometheus
  namespace: monitoring
spec:
  replicas: 3
  serviceName: prometheus-service
  template:
    metadata:
      labels:
        app: prometheus
        thanos-store-api: "true"
    spec:
      serviceAccountName: monitoring
      containers:
        - name: prometheus
          image: prom/prometheus:v2.4.3
          args:
            - "--config.file=/etc/prometheus-shared/prometheus.yaml"
            - "--storage.tsdb.path=/prometheus/"
            - "--web.enable-lifecycle"
            - "--storage.tsdb.no-lockfile"
            - "--storage.tsdb.min-block-duration=2h"
            - "--storage.tsdb.max-block-duration=2h"
          ports:
            - name: prometheus
              containerPort: 9090
          volumeMounts:
            - name: prometheus-storage
              mountPath: /prometheus/
            - name: prometheus-config-shared
              mountPath: /etc/prometheus-shared/
            - name: prometheus-rules
              mountPath: /etc/prometheus/rules
        - name: thanos
          image: quay.io/thanos/thanos:v0.8.0
          args:
            - "sidecar"
            - "--log.level=debug"
            - "--tsdb.path=/prometheus"
            - "--prometheus.url=http://127.0.0.1:9090"
            - "--objstore.config={type: GCS, config: {bucket: prometheus-long-term}}"
            - "--reloader.config-file=/etc/prometheus/prometheus.yaml.tmpl"
            - "--reloader.config-envsubst-file=/etc/prometheus-shared/prometheus.yaml"
            - "--reloader.rule-dir=/etc/prometheus/rules/"
          env:
            - name: POD_NAME
              valueFrom:
                fieldRef:
                  fieldPath: metadata.name
            - name : GOOGLE_APPLICATION_CREDENTIALS
              value: /etc/secret/thanos-gcs-credentials.json
          ports:
            - name: http-sidecar
              containerPort: 10902
            - name: grpc
              containerPort: 10901
          livenessProbe:
              httpGet:
                port: 10902
                path: /-/healthy
          readinessProbe:
            httpGet:
              port: 10902
              path: /-/ready
          volumeMounts:
            - name: prometheus-storage
              mountPath: /prometheus
            - name: prometheus-config-shared
              mountPath: /etc/prometheus-shared/
            - name: prometheus-config
              mountPath: /etc/prometheus
            - name: prometheus-rules
              mountPath: /etc/prometheus/rules
            - name: thanos-gcs-credentials
              mountPath: /etc/secret
              readOnly: false
      securityContext:
        fsGroup: 2000
        runAsNonRoot: true
        runAsUser: 1000
      volumes:
        - name: prometheus-config
          configMap:
            defaultMode: 420
            name: prometheus-server-conf
        - name: prometheus-config-shared
          emptyDir: {}
        - name: prometheus-rules
          configMap:
            name: prometheus-rules
        - name: thanos-gcs-credentials
          secret:
            secretName: thanos-gcs-credentials
  volumeClaimTemplates:
  - metadata:
      name: prometheus-storage
      namespace: monitoring
    spec:
      accessModes: [ "ReadWriteOnce" ]
      storageClassName: fast
      resources:
        requests:
          storage: 20Gi
关于上面提供的manifest,理解以下内容很重要:
-
Prometheus是作为一个有状态集部署的,有3个副本,每个副本动态地提供自己的持久化卷。
-
Prometheus配置是由Thanos sidecar容器使用我们上面创建的模板文件生成的。
-
Thanos处理数据压缩,因此我们需要设置--storage.tsdb.min-block-duration=2h和--storage.tsdb.max-block-duration=2h。
-
Prometheus有状态集被标记为thanos-store-api: true,这样每个pod就会被我们接下来创建的headless service发现。正是这个headless service将被Thanos Querier用来查询所有Prometheus实例的数据。我们还将相同的标签应用于Thanos Store和Thanos Ruler组件,这样它们也会被Querier发现,并可用于查询指标。
-
GCS bucket credentials路径是使用GOOGLE_APPLICATION_CREDENTIALS环境变量提供的,配置文件是由我们作为前期准备中创建的secret挂载到它上面的。
部署Prometheus服务
apiVersion: v1
kind: Service
metadata:
  name: prometheus-0-service
  annotations:
    prometheus.io/scrape: "true"
    prometheus.io/port: "9090"
  namespace: monitoring
  labels:
    name: prometheus
spec:
  selector:
    statefulset.kubernetes.io/pod-name: prometheus-0
  ports:
    - name: prometheus
      port: 8080
      targetPort: prometheus
---
apiVersion: v1
kind: Service
metadata:
  name: prometheus-1-service
  annotations:
    prometheus.io/scrape: "true"
    prometheus.io/port: "9090"
  namespace: monitoring
  labels:
    name: prometheus
spec:
  selector:
    statefulset.kubernetes.io/pod-name: prometheus-1
  ports:
    - name: prometheus
      port: 8080
      targetPort: prometheus
---
apiVersion: v1
kind: Service
metadata:
  name: prometheus-2-service
  annotations:
    prometheus.io/scrape: "true"
    prometheus.io/port: "9090"
  namespace: monitoring
  labels:
    name: prometheus
spec:
  selector:
    statefulset.kubernetes.io/pod-name: prometheus-2
  ports:
    - name: prometheus
      port: 8080
      targetPort: prometheus
---
#This service creates a srv record for querier to find about store-api's
apiVersion: v1
kind: Service
metadata:
  name: thanos-store-gateway
  namespace: monitoring
spec:
  type: ClusterIP
  clusterIP: None
  ports:
    - name: grpc
      port: 10901
      targetPort: grpc
  selector:
    thanos-store-api: "true"
除了上述方法外,你还可以点击这篇文章了解如何在Rancher上快速部署和配置Prometheus服务。
我们为stateful set中的每个Prometheus pod创建了不同的服务,尽管这并不是必要的。这些服务的创建只是为了调试。上文已经解释了 thanos-store-gateway headless service的目的。我们稍后将使用一个 ingress 对象来暴露 Prometheus 服务。
部署Prometheus Querier
apiVersion: v1
kind: Namespace
metadata:
  name: monitoring
---
apiVersion: apps/v1
kind: Deployment
metadata:
  name: thanos-querier
  namespace: monitoring
  labels:
    app: thanos-querier
spec:
  replicas: 1
  selector:
    matchLabels:
      app: thanos-querier
  template:
    metadata:
      labels:
        app: thanos-querier
    spec:
      containers:
      - name: thanos
        image: quay.io/thanos/thanos:v0.8.0
        args:
        - query
        - --log.level=debug
        - --query.replica-label=replica
        - --store=dnssrv+thanos-store-gateway:10901
        ports:
        - name: http
          containerPort: 10902
        - name: grpc
          containerPort: 10901
        livenessProbe:
          httpGet:
            port: http
            path: /-/healthy
        readinessProbe:
          httpGet:
            port: http
            path: /-/ready
---
apiVersion: v1
kind: Service
metadata:
  labels:
    app: thanos-querier
  name: thanos-querier
  namespace: monitoring
spec:
  ports:
  - port: 9090
    protocol: TCP
    targetPort: http
    name: http
  selector:
    app: thanos-querier
这是Thanos部署的主要内容之一。请注意以下几点:
-
容器参数
-store=dnssrv+thanos-store-gateway:10901有助于发现所有应查询的指标数据的组件。 -
thanos-querier服务提供了一个Web接口来运行PromQL查询。它还可以选择在不同的Prometheus集群中去重复删除数据。
-
这是我们提供Grafana作为所有dashboard的数据源的终点(end point)。
部署Thanos存储网关
apiVersion: v1
kind: Namespace
metadata:
  name: monitoring
---
apiVersion: apps/v1beta1
kind: StatefulSet
metadata:
  name: thanos-store-gateway
  namespace: monitoring
  labels:
    app: thanos-store-gateway
spec:
  replicas: 1
  selector:
    matchLabels:
      app: thanos-store-gateway
  serviceName: thanos-store-gateway
  template:
    metadata:
      labels:
        app: thanos-store-gateway
        thanos-store-api: "true"
    spec:
      containers:
        - name: thanos
          image: quay.io/thanos/thanos:v0.8.0
          args:
          - "store"
          - "--log.level=debug"
          - "--data-dir=/data"
          - "--objstore.config={type: GCS, config: {bucket: prometheus-long-term}}"
          - "--index-cache-size=500MB"
          - "--chunk-pool-size=500MB"
          env:
            - name : GOOGLE_APPLICATION_CREDENTIALS
              value: /etc/secret/thanos-gcs-credentials.json
          ports:
          - name: http
            containerPort: 10902
          - name: grpc
            containerPort: 10901
          livenessProbe:
            httpGet:
              port: 10902
              path: /-/healthy
          readinessProbe:
            httpGet:
              port: 10902
              path: /-/ready
          volumeMounts:
            - name: thanos-gcs-credentials
              mountPath: /etc/secret
              readOnly: false
      volumes:
        - name: thanos-gcs-credentials
          secret:
            secretName: thanos-gcs-credentials
---
这将创建存储组件,它将从对象存储中向Querier提供指标。
部署Thanos Ruler
apiVersion: v1
kind: Namespace
metadata:
  name: monitoring
---
apiVersion: v1
kind: ConfigMap
metadata:
  name: thanos-ruler-rules
  namespace: monitoring
data:
  alert_down_services.rules.yaml: |
    groups:
    - name: metamonitoring
      rules:
      - alert: PrometheusReplicaDown
        annotations:
          message: Prometheus replica in cluster {{$labels.cluster}} has disappeared from Prometheus target discovery.
        expr: |
          sum(up{cluster="prometheus-ha", instance=~".*:9090", job="kubernetes-service-endpoints"}) by (job,cluster) < 3
        for: 15s
        labels:
          severity: critical
---
apiVersion: apps/v1beta1
kind: StatefulSet
metadata:
  labels:
    app: thanos-ruler
  name: thanos-ruler
  namespace: monitoring
spec:
  replicas: 1
  selector:
    matchLabels:
      app: thanos-ruler
  serviceName: thanos-ruler
  template:
    metadata:
      labels:
        app: thanos-ruler
        thanos-store-api: "true"
    spec:
      containers:
        - name: thanos
          image: quay.io/thanos/thanos:v0.8.0
          args:
            - rule
            - --log.level=debug
            - --data-dir=/data
            - --eval-interval=15s
            - --rule-file=/etc/thanos-ruler/*.rules.yaml
            - --alertmanagers.url=http://alertmanager:9093
            - --query=thanos-querier:9090
            - "--objstore.config={type: GCS, config: {bucket: thanos-ruler}}"
            - --label=ruler_cluster="prometheus-ha"
            - --label=replica="$(POD_NAME)"
          env:
            - name : GOOGLE_APPLICATION_CREDENTIALS
              value: /etc/secret/thanos-gcs-credentials.json
            - name: POD_NAME
              valueFrom:
                fieldRef:
                  fieldPath: metadata.name
          ports:
            - name: http
              containerPort: 10902
            - name: grpc
              containerPort: 10901
          livenessProbe:
            httpGet:
              port: http
              path: /-/healthy
          readinessProbe:
            httpGet:
              port: http
              path: /-/ready
          volumeMounts:
            - mountPath: /etc/thanos-ruler
              name: config
            - name: thanos-gcs-credentials
              mountPath: /etc/secret
              readOnly: false
      volumes:
        - configMap:
            name: thanos-ruler-rules
          name: config
        - name: thanos-gcs-credentials
          secret:
            secretName: thanos-gcs-credentials
---
apiVersion: v1
kind: Service
metadata:
  labels:
    app: thanos-ruler
  name: thanos-ruler
  namespace: monitoring
spec:
  ports:
    - port: 9090
      protocol: TCP
      targetPort: http
      name: http
  selector:
    app: thanos-ruler
现在,如果你在与我们的工作负载相同的命名空间中启动交互式shell,并尝试查看我们的thanos-store-gateway解析到哪些pods,你会看到以下内容:
root@my-shell-95cb5df57-4q6w8:/# nslookup thanos-store-gateway
Server:    10.63.240.10
Address:  10.63.240.10#53

Name:  thanos-store-gateway.monitoring.svc.cluster.local
Address: 10.60.25.2
Name:  thanos-store-gateway.monitoring.svc.cluster.local
Address: 10.60.25.4
Name:  thanos-store-gateway.monitoring.svc.cluster.local
Address: 10.60.30.2
Name:  thanos-store-gateway.monitoring.svc.cluster.local
Address: 10.60.30.8
Name:  thanos-store-gateway.monitoring.svc.cluster.local
Address: 10.60.31.2

root@my-shell-95cb5df57-4q6w8:/# exit
上面返回的IP对应的是我们的Prometheus Pod、thanos-store和thanos-ruler。这可以被验证为:
$ kubectl get pods -o wide -l thanos-store-api="true"
NAME                     READY   STATUS    RESTARTS   AGE    IP           NODE                              NOMINATED NODE   READINESS GATES
prometheus-0             2/2     Running   0          100m   10.60.31.2   gke-demo-1-pool-1-649cbe02-jdnv   <none>           <none>
prometheus-1             2/2     Running   0          14h    10.60.30.2   gke-demo-1-pool-1-7533d618-kxkd   <none>           <none>
prometheus-2             2/2     Running   0          31h    10.60.25.2   gke-demo-1-pool-1-4e9889dd-27gc   <none>           <none>
thanos-ruler-0           1/1     Running   0          100m   10.60.30.8   gke-demo-1-pool-1-7533d618-kxkd   <none>           <none>
thanos-store-gateway-0   1/1     Running   0          14h    10.60.25.4   gke-demo-1-pool-1-4e9889dd-27gc   <none>           <none>
部署Alertmanager
apiVersion: v1
kind: Namespace
metadata:
  name: monitoring
---
kind: ConfigMap
apiVersion: v1
metadata:
  name: alertmanager
  namespace: monitoring
data:
  config.yml: |-
    global:
      resolve_timeout: 5m
      slack_api_url: "<your_slack_hook>"
      victorops_api_url: "<your_victorops_hook>"

    templates:
    - '/etc/alertmanager-templates/*.tmpl'
    route:
      group_by: ['alertname', 'cluster', 'service']
      group_wait: 10s
      group_interval: 1m
      repeat_interval: 5m
      receiver: default
      routes:
      - match:
          team: devops
        receiver: devops
        continue: true
      - match:
          team: dev
        receiver: dev
        continue: true

    receivers:
    - name: 'default'

    - name: 'devops'
      victorops_configs:
      - api_key: '<YOUR_API_KEY>'
        routing_key: 'devops'
        message_type: 'CRITICAL'
        entity_display_name: '{{ .CommonLabels.alertname }}'
        state_message: 'Alert: {{ .CommonLabels.alertname }}. Summary:{{ .CommonAnnotations.summary }}. RawData: {{ .CommonLabels }}'
      slack_configs:
      - channel: '#k8-alerts'
        send_resolved: true


    - name: 'dev'
      victorops_configs:
      - api_key: '<YOUR_API_KEY>'
        routing_key: 'dev'
        message_type: 'CRITICAL'
        entity_display_name: '{{ .CommonLabels.alertname }}'
        state_message: 'Alert: {{ .CommonLabels.alertname }}. Summary:{{ .CommonAnnotations.summary }}. RawData: {{ .CommonLabels }}'
      slack_configs:
      - channel: '#k8-alerts'
        send_resolved: true

---
apiVersion: extensions/v1beta1
kind: Deployment
metadata:
  name: alertmanager
  namespace: monitoring
spec:
  replicas: 1
  selector:
    matchLabels:
      app: alertmanager
  template:
    metadata:
      name: alertmanager
      labels:
        app: alertmanager
    spec:
      containers:
      - name: alertmanager
        image: prom/alertmanager:v0.15.3
        args:
          - '--config.file=/etc/alertmanager/config.yml'
          - '--storage.path=/alertmanager'
        ports:
        - name: alertmanager
          containerPort: 9093
        volumeMounts:
        - name: config-volume
          mountPath: /etc/alertmanager
        - name: alertmanager
          mountPath: /alertmanager
      volumes:
      - name: config-volume
        configMap:
          name: alertmanager
      - name: alertmanager
        emptyDir: {}
---
apiVersion: v1
kind: Service
metadata:
  annotations:
    prometheus.io/scrape: 'true'
    prometheus.io/path: '/metrics'
  labels:
    name: alertmanager
  name: alertmanager
  namespace: monitoring
spec:
  selector:
    app: alertmanager
  ports:
  - name: alertmanager
    protocol: TCP
    port: 9093
    targetPort: 9093
这将创建我们的Alertmanager部署,它将根据Prometheus规则生成所有告警。
部署Kubestate指标
apiVersion: v1
kind: Namespace
metadata:
  name: monitoring
---
apiVersion: rbac.authorization.k8s.io/v1
# kubernetes versions before 1.8.0 should use rbac.authorization.k8s.io/v1beta1
kind: ClusterRoleBinding
metadata:
  name: kube-state-metrics
roleRef:
  apiGroup: rbac.authorization.k8s.io
  kind: ClusterRole
  name: kube-state-metrics
subjects:
- kind: ServiceAccount
  name: kube-state-metrics
  namespace: monitoring
---
apiVersion: rbac.authorization.k8s.io/v1
# kubernetes versions before 1.8.0 should use rbac.authorization.k8s.io/v1beta1
kind: ClusterRole
metadata:
  name: kube-state-metrics
rules:
- apiGroups: [""]
  resources:
  - configmaps
  - secrets
  - nodes
  - pods
  - services
  - resourcequotas
  - replicationcontrollers
  - limitranges
  - persistentvolumeclaims
  - persistentvolumes
  - namespaces
  - endpoints
  verbs: ["list", "watch"]
- apiGroups: ["extensions"]
  resources:
  - daemonsets
  - deployments
  - replicasets
  verbs: ["list", "watch"]
- apiGroups: ["apps"]
  resources:
  - statefulsets
  verbs: ["list", "watch"]
- apiGroups: ["batch"]
  resources:
  - cronjobs
  - jobs
  verbs: ["list", "watch"]
- apiGroups: ["autoscaling"]
  resources:
  - horizontalpodautoscalers
  verbs: ["list", "watch"]
---
apiVersion: rbac.authorization.k8s.io/v1
# kubernetes versions before 1.8.0 should use rbac.authorization.k8s.io/v1beta1
kind: RoleBinding
metadata:
  name: kube-state-metrics
  namespace: monitoring
roleRef:
  apiGroup: rbac.authorization.k8s.io
  kind: Role
  name: kube-state-metrics-resizer
subjects:
- kind: ServiceAccount
  name: kube-state-metrics
  namespace: monitoring
---
apiVersion: rbac.authorization.k8s.io/v1
# kubernetes versions before 1.8.0 should use rbac.authorization.k8s.io/v1beta1
kind: Role
metadata:
  namespace: monitoring
  name: kube-state-metrics-resizer
rules:
- apiGroups: [""]
  resources:
  - pods
  verbs: ["get"]
- apiGroups: ["extensions"]
  resources:
  - deployments
  resourceNames: ["kube-state-metrics"]
  verbs: ["get", "update"]
---
apiVersion: v1
kind: ServiceAccount
metadata:
  name: kube-state-metrics
  namespace: monitoring
---
apiVersion: apps/v1
kind: Deployment
metadata:
  name: kube-state-metrics
  namespace: monitoring
spec:
  selector:
    matchLabels:
      k8s-app: kube-state-metrics
  replicas: 1
  template:
    metadata:
      labels:
        k8s-app: kube-state-metrics
    spec:
      serviceAccountName: kube-state-metrics
      containers:
      - name: kube-state-metrics
        image: quay.io/mxinden/kube-state-metrics:v1.4.0-gzip.3
        ports:
        - name: http-metrics
          containerPort: 8080
        - name: telemetry
          containerPort: 8081
        readinessProbe:
          httpGet:
            path: /healthz
            port: 8080
          initialDelaySeconds: 5
          timeoutSeconds: 5
      - name: addon-resizer
        image: k8s.gcr.io/addon-resizer:1.8.3
        resources:
          limits:
            cpu: 150m
            memory: 50Mi
          requests:
            cpu: 150m
            memory: 50Mi
        env:
          - name: MY_POD_NAME
            valueFrom:
              fieldRef:
                fieldPath: metadata.name
          - name: MY_POD_NAMESPACE
            valueFrom:
              fieldRef:
                fieldPath: metadata.namespace
        command:
          - /pod_nanny
          - --container=kube-state-metrics
          - --cpu=100m
          - --extra-cpu=1m
          - --memory=100Mi
          - --extra-memory=2Mi
          - --threshold=5
          - --deployment=kube-state-metrics
---
apiVersion: v1
kind: Service
metadata:
  name: kube-state-metrics
  namespace: monitoring
  labels:
    k8s-app: kube-state-metrics
  annotations:
    prometheus.io/scrape: 'true'
spec:
  ports:
  - name: http-metrics
    port: 8080
    targetPort: http-metrics
    protocol: TCP
  - name: telemetry
    port: 8081
    targetPort: telemetry
    protocol: TCP
  selector:
    k8s-app: kube-state-metrics
Kubestate指标部署需要转发一些重要的容器指标,这些指标不是kubelet原生暴露的,因此不能直接提供给Prometheus。
部署Node-Exporter Daemonset
apiVersion: v1
kind: Namespace
metadata:
  name: monitoring
---
apiVersion: extensions/v1beta1
kind: DaemonSet
metadata:
  name: node-exporter
  namespace: monitoring
  labels:
    name: node-exporter
spec:
  template:
    metadata:
      labels:
        name: node-exporter
      annotations:
         prometheus.io/scrape: "true"
         prometheus.io/port: "9100"
    spec:
      hostPID: true
      hostIPC: true
      hostNetwork: true
      containers:
        - name: node-exporter
          image: prom/node-exporter:v0.16.0
          securityContext:
            privileged: true
          args:
            - --path.procfs=/host/proc
            - --path.sysfs=/host/sys
          ports:
            - containerPort: 9100
              protocol: TCP
          resources:
            limits:
              cpu: 100m
              memory: 100Mi
            requests:
              cpu: 10m
              memory: 100Mi
          volumeMounts:
            - name: dev
              mountPath: /host/dev
            - name: proc
              mountPath: /host/proc
            - name: sys
              mountPath: /host/sys
            - name: rootfs
              mountPath: /rootfs
      volumes:
        - name: proc
          hostPath:
            path: /proc
        - name: dev
          hostPath:
            path: /dev
        - name: sys
          hostPath:
            path: /sys
        - name: rootfs
          hostPath:
            path: /
Node-Exporter daemonset在每个节点上运行一个node-exporter的pod,并暴露出非常重要的节点相关指标,这些指标可以被Prometheus实例拉取。
部署Grafana
apiVersion: v1
kind: Namespace
metadata:
  name: monitoring
---
apiVersion: storage.k8s.io/v1beta1
kind: StorageClass
metadata:
  name: fast
  namespace: monitoring
provisioner: kubernetes.io/gce-pd
allowVolumeExpansion: true
---
apiVersion: apps/v1beta1
kind: StatefulSet
metadata:
  name: grafana
  namespace: monitoring
spec:
  replicas: 1
  serviceName: grafana
  template:
    metadata:
      labels:
        task: monitoring
        k8s-app: grafana
    spec:
      containers:
      - name: grafana
        image: k8s.gcr.io/heapster-grafana-amd64:v5.0.4
        ports:
        - containerPort: 3000
          protocol: TCP
        volumeMounts:
        - mountPath: /etc/ssl/certs
          name: ca-certificates
          readOnly: true
        - mountPath: /var
          name: grafana-storage
        env:
        - name: GF_SERVER_HTTP_PORT
          value: "3000"
          # The following env variables are required to make Grafana accessible via
          # the kubernetes api-server proxy. On production clusters, we recommend
          # removing these env variables, setup auth for grafana, and expose the grafana
          # service using a LoadBalancer or a public IP.
        - name: GF_AUTH_BASIC_ENABLED
          value: "false"
        - name: GF_AUTH_ANONYMOUS_ENABLED
          value: "true"
        - name: GF_AUTH_ANONYMOUS_ORG_ROLE
          value: Admin
        - name: GF_SERVER_ROOT_URL
          # If you're only using the API Server proxy, set this value instead:
          # value: /api/v1/namespaces/kube-system/services/monitoring-grafana/proxy
          value: /
      volumes:
      - name: ca-certificates
        hostPath:
          path: /etc/ssl/certs
  volumeClaimTemplates:
  - metadata:
      name: grafana-storage
      namespace: monitoring
    spec:
      accessModes: [ "ReadWriteOnce" ]
      storageClassName: fast
      resources:
        requests:
          storage: 5Gi
---
apiVersion: v1
kind: Service
metadata:
  labels:
    kubernetes.io/cluster-service: 'true'
    kubernetes.io/name: grafana
  name: grafana
  namespace: monitoring
spec:
  ports:
  - port: 3000
    targetPort: 3000
  selector:
    k8s-app: grafana
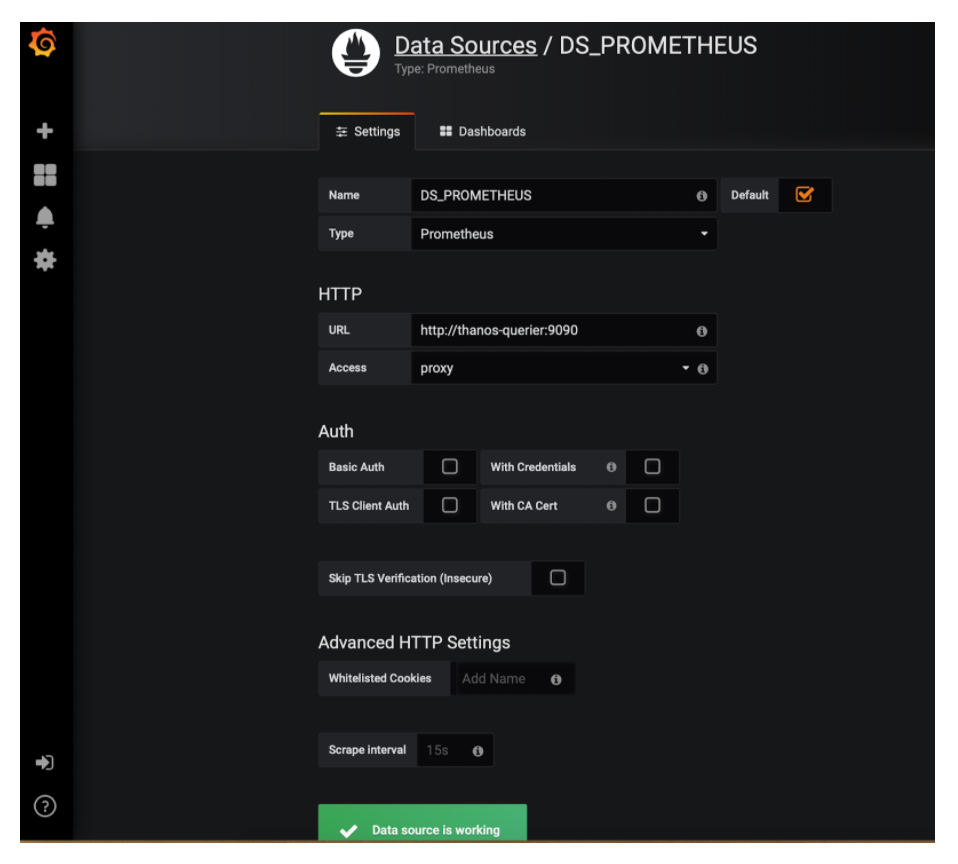
这将创建我们的Grafana部署和服务,它将使用我们的Ingress对象暴露。为了做到这一点,我们应该添加Thanos-Querier作为我们Grafana部署的数据源:
-
点击添加数据源
-
设置Name: DS_PROMETHEUS
-
设置Type: Prometheus
-
设置URL: http://thanos-querier:9090
-
保存并测试。现在你可以构建你的自定义dashboard或从grafana.net简单导入dashboard。Dashboard #315和#1471都非常适合入门。
部署Ingress对象
apiVersion: extensions/v1beta1
kind: Ingress
metadata:
  name: monitoring-ingress
  namespace: monitoring
  annotations:
    kubernetes.io/ingress.class: "nginx"
spec:
  rules:
  - host: grafana.<yourdomain>.com
    http:
      paths:
      - path: /
        backend:
          serviceName: grafana
          servicePort: 3000
  - host: prometheus-0.<yourdomain>.com
    http:
      paths:
      - path: /
        backend:
          serviceName: prometheus-0-service
          servicePort: 8080
  - host: prometheus-1.<yourdomain>.com
    http:
      paths:
      - path: /
        backend:
          serviceName: prometheus-1-service
          servicePort: 8080
  - host: prometheus-2.<yourdomain>.com
    http:
      paths:
      - path: /
        backend:
          serviceName: prometheus-2-service
          servicePort: 8080
  - host: alertmanager.<yourdomain>.com
    http:
      paths:
      - path: /
        backend:
          serviceName: alertmanager
          servicePort: 9093
  - host: thanos-querier.<yourdomain>.com
    http:
      paths:
      - path: /
        backend:
          serviceName: thanos-querier
          servicePort: 9090
  - host: thanos-ruler.<yourdomain>.com
    http:
      paths:
      - path: /
        backend:
          serviceName: thanos-ruler
          servicePort: 9090
这是拼图的最后一块。有助于将我们的所有服务暴露在Kubernetes集群之外,并帮助我们访问它们。确保将
现在你应该可以访问Thanos Querier,网址是:http://thanos-querier.
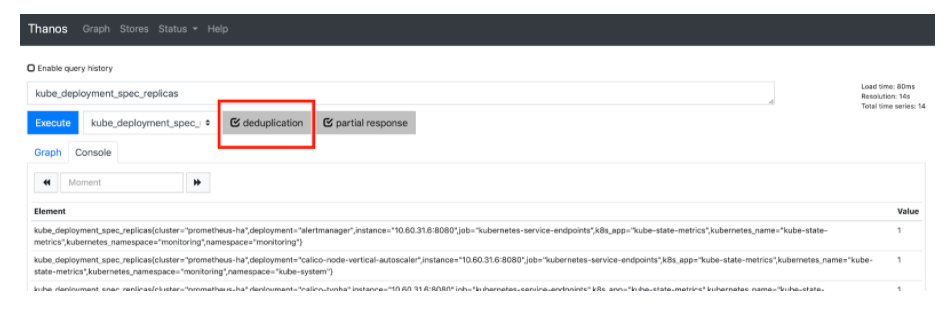
确保选中重复数据删除(deduplication)。
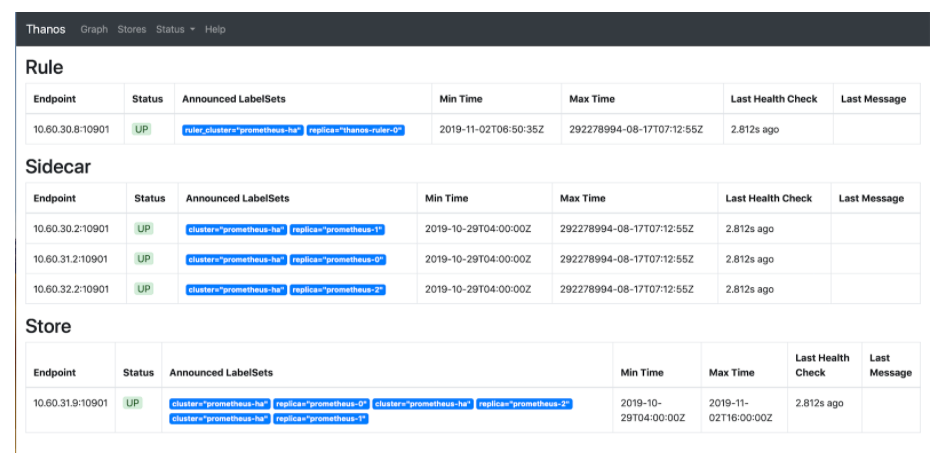
如果你点击Store,可以看到所有由thanos-store-gateway服务发现的活动端点。
现在你可以在Grafana中添加Thanos Querier作为数据源,并开始创建dashboard。
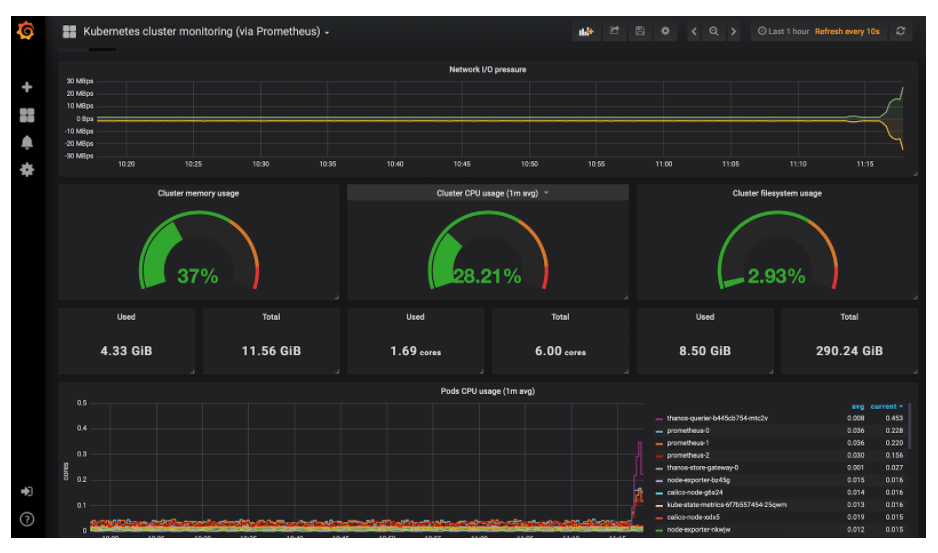
Kubernetes集群监控dashboard
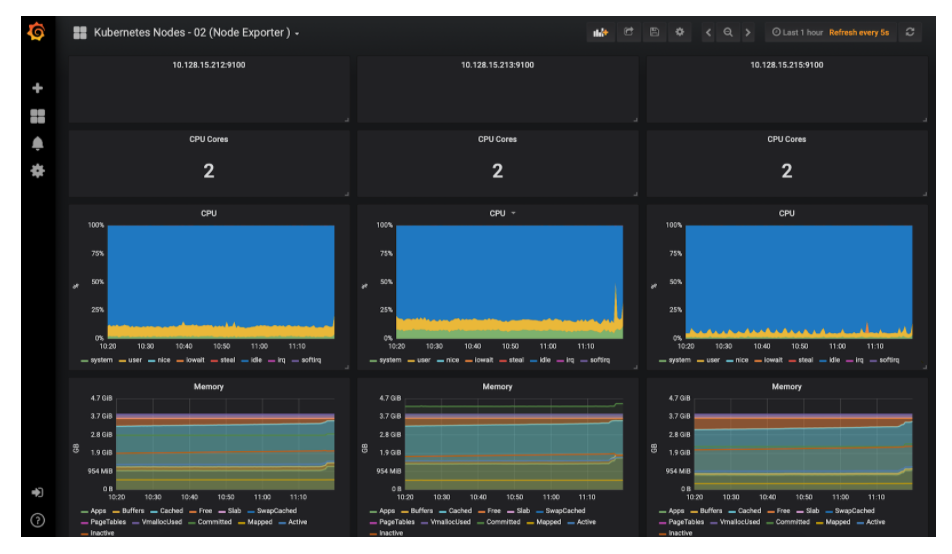
Kubernetes节点监控dashboard
总 结
将Thanos与Prometheus集成在一起,无疑提供了横向扩展Prometheus的能力,而且由于Thanos-Querier能够从其他querier实例中提取指标数据,因此实际上你可以跨集群提取指标数据,并在一个单一的仪表板中可视化。
我们还能够将指标数据归档在对象存储中,为我们的监控系统提供无限的存储空间,同时从对象存储本身提供指标数据。这种设置的主要成本部分可以归结为对象存储(S3或GCS)。如果我们对它们应用适当的保留策略,可以进一步降低成本。
然而,实现这一切需要你进行大量的配置。上面提供的manifest已经在生产环境中进行了测试,你可以大胆进行尝试。