python制作简单excel统计报表3之将mysql数据库中的数据导入excel模板并生成统计图
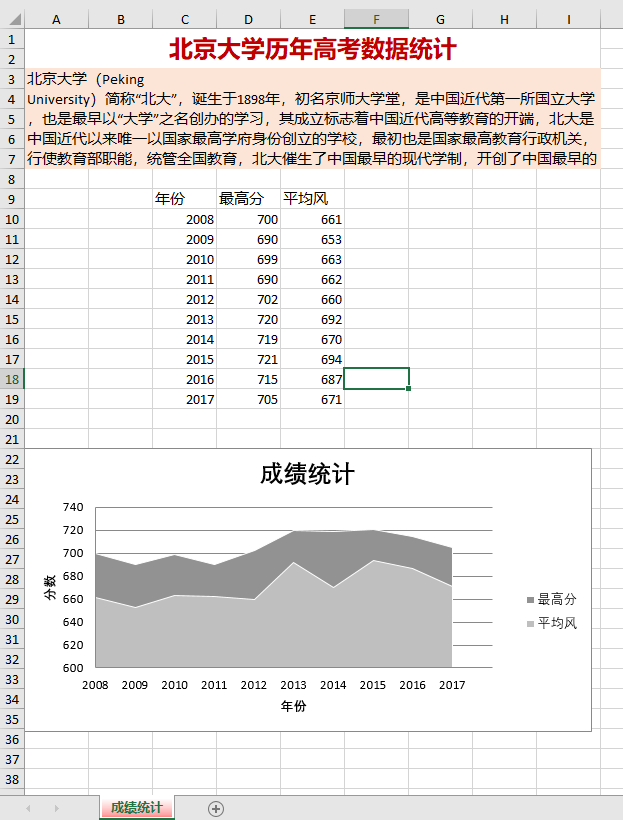
# coding=utf-8
from openpyxl import load_workbook
from openpyxl.chart import (
    AreaChart,
    Reference
)
import MySQLdb


class GaokaoExport(object):
    def __init__(self):

        self.wb = load_workbook('./static/tongji_example.xlsx')
        self.ws = self.wb.active
        self.ws.title = '成绩统计'
        self.ws.sheet_properties.tabColor = 'ff0000'

    def get_conn(self):
        """ 获取mysql 的链接"""
        global conn
        try:
            conn = MySQLdb.connect(
                db = 'user_grade',
                host = 'localhost',
                user = 'root',
                password = 'root',
                charset = 'utf8'
            )
        except:
            pass
        return conn

    def export_data(self):
        # 取出数据库中的数据
        conn = self.get_conn()
        cur = conn.cursor()
        sql = "select year,max,avg from score"
        cur.execute(sql)
        rows = cur.fetchall()

        # 循环写入到excel中
        row_id = 10     # excel的第10行开始
        for (i, row) in enumerate(rows):
            (self.ws['C{0}'.format(row_id)],
            self.ws['D{0}'.format(row_id)],
            self.ws['E{0}'.format(row_id)]) = row
            row_id += 1

        # 显示图表
        # 参考:https://openpyxl.readthedocs.io/en/stable/charts/area.html#d-area-charts
        chart = AreaChart()
        chart.title = "成绩统计"
        chart.style = 13
        chart.x_axis.title = '年份'
        chart.y_axis.title = '分数'

        # 横坐标
        cats = Reference(self.ws, min_col=3, min_row=10, max_row=row_id)
        # 数据区域
        data = Reference(self.ws, min_col=4, min_row=9, max_col=5, max_row=row_id)
        chart.add_data(data, titles_from_data=True)
        chart.set_categories(cats)

        self.ws.add_chart(chart, "A{0}".format(row_id + 2))

        # 保存到excel中
        self.wb.save('./static/jieguo01.xlsx')
        self.wb.close()


if __name__ == "__main__":
    client = GaokaoExport()
    client.export_data()
mysql表数据:
create database user_grade charset=utf8mb4;
use user_grade;
SET NAMES utf8mb4;
SET FOREIGN_KEY_CHECKS = 0;
DROP TABLE IF EXISTS `score`;
CREATE TABLE `score` (
`id` int(11) UNSIGNED NOT NULL AUTO_INCREMENT,
`year` int(11) NULL DEFAULT NULL,
`max` int(11) NULL DEFAULT NULL,
`avg` int(11) NULL DEFAULT NULL,
PRIMARY KEY (`id`) USING BTREE
) ENGINE = InnoDB CHARACTER SET = utf8mb4 COLLATE = utf8mb4_bin;
INSERT INTO `score` VALUES (25, 2008, 700, 661);
INSERT INTO `score` VALUES (26, 2009, 690, 653);
INSERT INTO `score` VALUES (27, 2010, 699, 663);
INSERT INTO `score` VALUES (28, 2011, 690, 662);
INSERT INTO `score` VALUES (29, 2012, 702, 660);
INSERT INTO `score` VALUES (30, 2013, 720, 692);
INSERT INTO `score` VALUES (31, 2014, 719, 670);
INSERT INTO `score` VALUES (32, 2015, 721, 694);
INSERT INTO `score` VALUES (33, 2016, 715, 687);
INSERT INTO `score` VALUES (34, 2017, 705, 671);
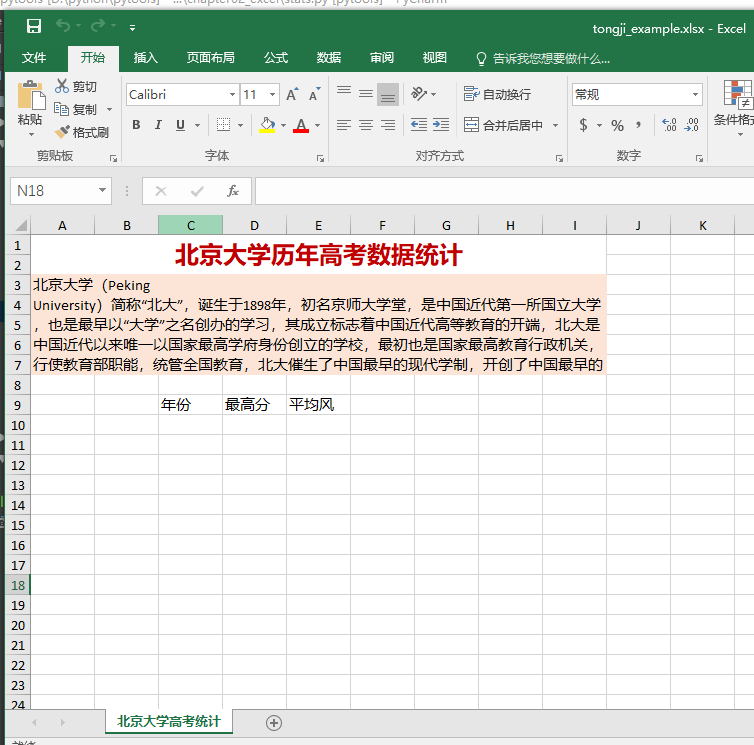
高考数据统计模板:
excel的统计结果