https://learn.unity.com/tutorial/diagnosing-performance-problems
Diagnosing performance problems using the Profiler window
Introduction
Different problems requrie very different solutions
Before we begin
A brief introduction to performance in games
Frame rate is standard measure of performance in games.
Recording profiling data
Analyzing profiling data
As we know, frame rate drops occur when Unity is unable to complete all of the tasks required to render a frame in a timely manner.
The CPU usage profiler
The Hierarchy view
The Timeline view
The Timeline view shows us two things: the order in which CPU tasks are performed, and which thread is responsible for which tasks.
Threads allow separate tasks to happen simultaneously; while one thread performs one task, another thread can perform a completely separate task. There are three types of thread invovled in Unity's rendering process: the main thread, the render thread and worker threads.
We can see that Shadows.RenderJob calls functions that take place on the main thread. We can also see worker threads performing tasks related to shadows.
Other profilers
Determining the cause of performance problems
Rule out VSync
Vertical Synchronization, known as VSync, is used to match a game's frame rate to the refresh rate of the screen it is being displayed on.
Hiding VSync information in the CPU usage profiler
Disregarding VSync information in the Hierarchy view
Whenever we see a function called WaitForTargetFPS in the Hierarchy view, this means that our game is waiting for VSync. We do not need to investigate this function and can safely ignore it
Disabling VSync
VSync cannot be disabled on all platforms: many (such as iOS) enforce its use. However, if we are developing for a platform that does not enforce VSync we can disable it altogether in our project while we profile.
Rendering profiling
Put very simply, the central processing unit (CPU) is responsible for determining what must be drawn and the graphics processing unit (GPU) is responsible for drawing it.
CPU bound: CPU taking too long to render a frame
GPU bound: GPU taking too long to render a frame
Identifying if our game is GPU bound
not all devices and drivers support this profiler
If the GPU time is excess of the CPU time, we have identified that our game is GPU bound at this point

If the GPU usage profiler is not available for our target hardware, we can still identify if our game is GPU bound
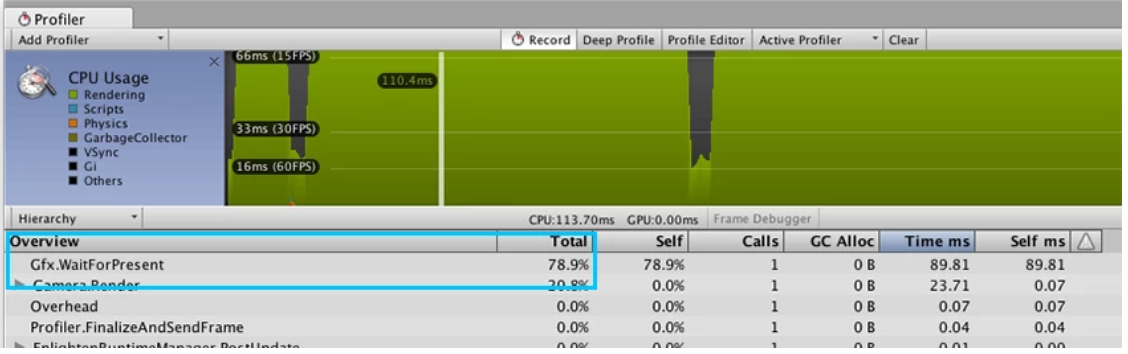
If the function Gfx.WaitForPresent is taking the longest in the CPU Usage profiler, this indicates that the CPU is waiting for the GPU. This means that our game is GPU bound at this point
Identifying if our game is CPU bound
If the top function is a rendering function, the CPU profiler graph will highlight it as part of the Rendering display. If this is the case, this means that rendering-related operations are causing our game to perform poorly and our game is CPU bound at this point.
Garbage Collection profiling
If the function GC.Collect() appears and is taking up excessive CPU time, then we have identified a garbage collection problem with our game.
Physics profiling
Solving physics problems
Slow scripts
Solving slow script problems
Other causes of performance problems