1. Pursuing Performance Problems (已看)
Pursuing Performance Problems, provides an exploration of the Unity Profiler and a series of methods to profile our application, detect performance bottlenecks, and perform root cause analysis.
Scripting Strategies, deals with the best practices for our Unity C# Script code, minimizing MonoBehaviour callback overhead, improving interobject communication, and more.
3. The Benefits of Batching (已看)
The Benefits of Batching, explores Unity's Dynamic Batching and Static Batching systems, and how they can be utilized to ease the burden on the Rendering Pipeline.
Kickstart Your Art, helps you understand the underlying technology behind art assets and learn how to avoid common pitfalls with importing, compression, and encoding.
Faster Physics, is about investigating the nuances of Unity's internal Physics Engines for both 3D and 2D games, and how to properly organize our physics objects for improved performance.
6. Dynamic Graphics (已看)
Dynamic Graphics, provides an in-depth exploration of the Rendering Pipeline, and how to improve applications that suffer rendering bottlenecks in the GPU, or CPU, how to optimize graphical effects such as lighting, shadows, and Particle Effects, ways in which to ptimize Shader code, and some specific techniques for mobile devices.
7. Virtual Velocity and Augmented Acceleration
Virtual Velocity and Augmented Acceleration, focuses on the new entertainment mediums of Virtual Reality (VR) and Augmented Reality (AR), and includes several techniques for optimizing performance that are unique to apps built for these platforms.
8. Masterful Memory Management (已看)
Masterful Memory Management, examines the inner workings of the Unity Engine, the Mono Framework, and how memory is managed within these components to protect our application from excessive heap allocations and runtime garbage collection.
Tactical Tips and Tricks, closes the book with a multitude of useful techniques used by Unity professionals to improve project workflow and scene management.
1. Pursuing Performance Problems
The Unity Profiler
The different subsystems it can gather data for are listed as follows:
- CPU consumption (per-major subsystem)
- Basic and detailed rendering and GPU information
- Runtime memory allocations and overall consumption
- Audio source/data usage
- Physics Engine (2D and 3D) usage
- Network messaging and operation usage
- Video playback usage
- Basic and detailed user interface performance (new in Unity 2017)
- Global Illumination statistics (new in Unity 2017)
There are generally two approaches to make use of a profiling tool: instrumentation and benchmarking (although, admittedly, the two terms are often used interchangeably).
Instrumentation typically means taking a close look into the inner workings of the application by observing the behavior of targeted function calls, where/how much memory is being allocated, and, generally getting an accurate picture of what is happening with the hope of finding the root cause of a problem. However, this is normally not an efficient way of starting to find performance problems because profiling of any application comes with a performance cost of its own.
When a Unity application is compiled in Development Mode (determined by the Development Build flag in the Build Settings menu), additional compiler flags are enabled causing the application to generate special events at runtime, which get logged and stored by the Profiler. Naturally, this will cause additional CPU and memory overhead at runtime due to all of the extraworkload the application takes on. Even worse, if the application is being profiled through the Unity Editor, then even more CPU and memory will be spent, ensuring that the Editor updates its interface, renders additional windows (such as the Scene window), and handles background tasks. This profiling cost is not always negligible. In excessively large projects, it can sometimes cause wildly inconsistent behavior when the Profiler is enabled. In some cases, the inconsistency is significant enough to cause completely unexpected behavior due to changes in event timings and potential race conditions in asynchronous behavior. This is a necessary price we pay for a deep analysis of our code's behavior at runtime, and we should always be aware of its presence.
Before we get ahead of ourselves and start analyzing every line of code in our application, it would be wiser to perform a surface-level measurement of the application. We should gather some rudimentary data and perform test scenarios during a runtime session of our game while it runs on the target hardware; the test case could simply be a few seconds of Gameplay, playback of a cut scene, a partial play through of a level, and so on. The idea of this activity is to get a general feel for what the user might experience and keep
watching for moments when performance becomes noticeably worse. Such problems may be severe enough to warrant further analysis.
This activity is commonly known as benchmarking, and the important metrics we're interested in are often the number of frames per-second (FPS) being rendered, overall memory consumption, how CPU activity behaves (looking for large spikes in activity), and sometimes CPU/GPU temperature. These are all relatively simple metrics to collect and can be used as a best first approach to performance analysis for one important reason; it will save us an enormous amount of time in the long run, since it ensures that we only
spend our time investigating problems that users would notice.
We should dig deeper into instrumentation only after a benchmarking test indicates that further analysis is required. It is also very important to benchmark by simulating actual platform behavior as much as possible if we want a realistic data sample. As such, we should never accept benchmarking data that was generated through Editor Mode as representative of real gameplay, since Editor Mode comes with some additional overhead costs thatmight mislead us, or hide potential race conditions in a real application. Instead, we should hook the profiling tool into the application while it is running in a standalone format on the target hardware
Many Unity developers are surprised to find that the Editor sometimes calculates the results of operations much faster than a standalone application does. This is particularly common when dealing with serialized data like audio files, Prefabs and Scriptable Objects. This is because the Editor will cache previously imported data and is able to access it much faster than a real application would
Launching the Profiler
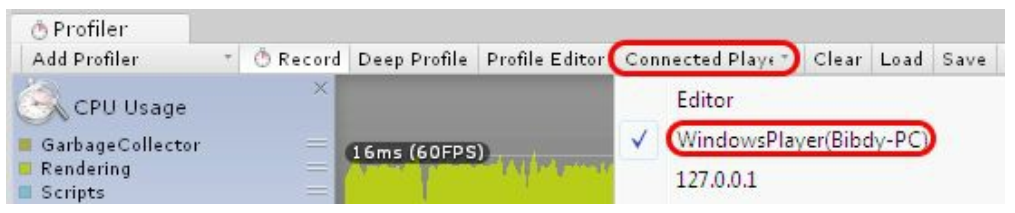
Editor or standalone instances
ensure that the Development Build and Autoconnect Profiler flags are enabled
Connecting to a WebGL instance
Remote connection to an iOS device
https://docs.unity3d.com/Manual/TroubleShootingIPhone.html
Remote connection to an Android device
https://docs.unity3d.com/Manual/TroubleShootingAndroid.html
Editor profiling
We can profile the Editor itself. This is normally used when trying to profile the performance of custom Editor Scripts.
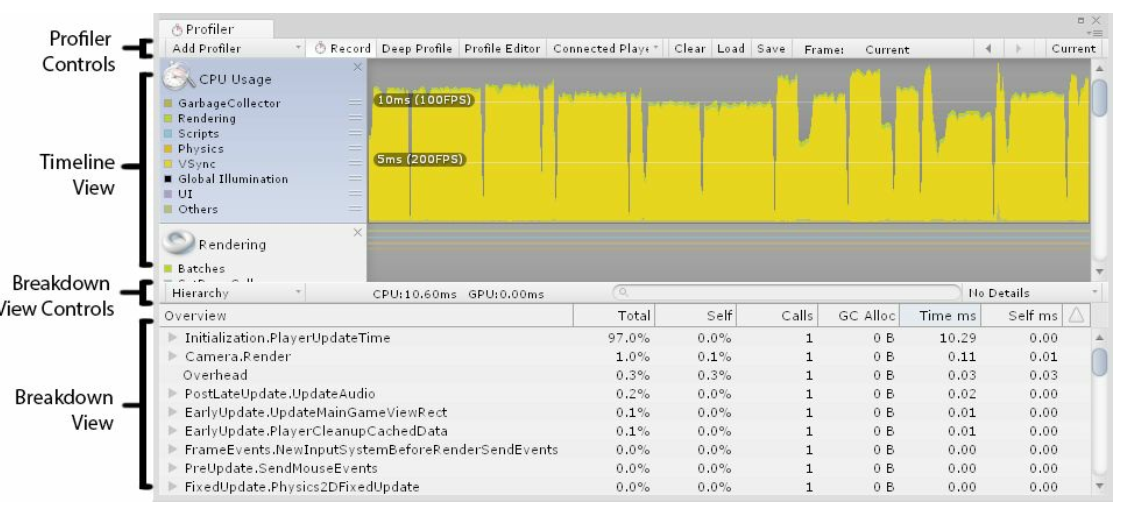
The Profiler window
The Profiler window is split into four main sections
- Profiler Controls
- Timeline View
- Breakdown View Controls
- Breakdown View
Profiler controls
Add Profiler
Record
Deep Profile
Enabling the Deep Profile option re-compiles our scripts with much deeper level of instrumentation, allowing it to measure each and every invoked method
Profile Editor
Connected Player
Clear
Load
Save
Frame Selection
Timeline View
Breakdown View Controls
Breakdown View
The CPU Usage Area
Hierarchy mode reveals most callstack invocations, while grouping similar data elements and global Unity function calls together for convenience. For instance, rendering delimiters, such as BeginGUI() and EndGUI() calls, are combined together in this mode. Hierarchy mode is helpful as an initial first step to determine which function calls cost the most CPU time to execute.
Raw Hierarchy mode is similar to Hierarchy mode, except it will separate global Unity function calls into separate entries rather than being combined into one bulk entry. This will tend to make the Breakdown View more difficult to read, but may be helpful if we're trying to count how many times a particular global method is invoked or determining whether one of these calls is costing more CPU/memory than expected. For example, each BeginGUI() and EndGUI() calls will be separated into different entries, making it more clear how many times each is being called compared to the Hierarchy mode.
Perhaps, the most useful mode for the CPU Usage Area is the Timeline mode option (not to be confused with the main Timeline View). This mode organizes CPU usage during the current frame by how the call stack expanded and contracted during processing.
Timeline mode organizes the Breakdown View vertically into different sections that represent different threads at runtime, such as Main Thread, Render Thread, and various background job threads called Unity Job System,used for loading activity such as scenes and other assets. The horizontal axis represents time, so wider blocks are consuming more CPU time than narrower blocks. The horizontal size also represents relative time, making it easy to compare how much time one function call took compared to another. The vertical axis represents the callstack, so deeper chains represent more calls in the callstack at that time.
Under Timeline mode, blocks at the top of the Breakdown View are functions (or technically, callbacks) called by the Unity Engine at runtime (such as Start(), Awake(), or Update() ), whereas blocks underneath them are functions that those functions had called into, which can include functions on other Components or regular C# objects.
The Timeline mode offers a very clean and organized way to determine which particular method in the callstack consumes the most time and how that processing time measures up against other methods being called during the same frame. This allows us to gauge the method that is the biggest cause of performance problems with minimal effort.
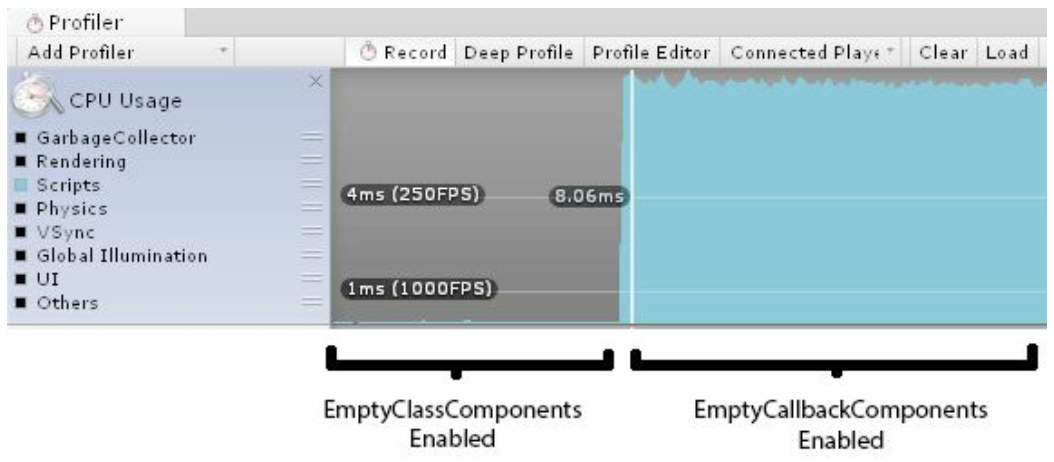
For example, let's assume that we are looking at a performance problem in the following screenshot. We can tell, with a quick glance, that there are three methods that are causing a problem, and they each consume similar amounts of processing time, due to their similar widths:
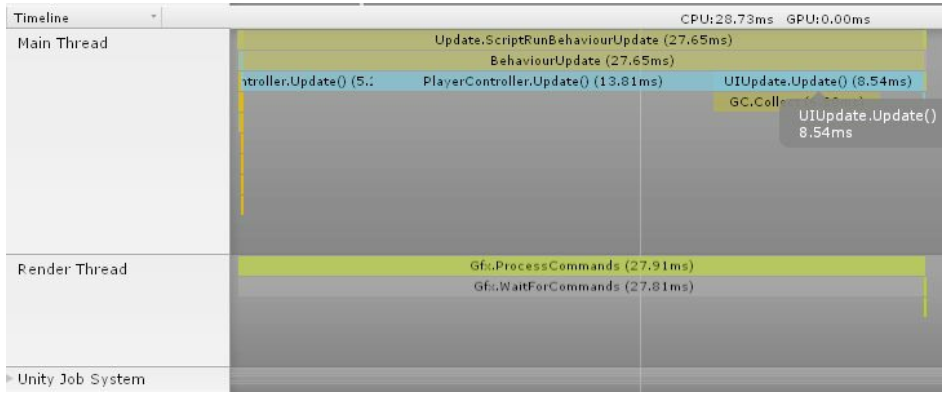
In the previous screenshot, we have exceeded our 16.667 millisecond budget with calls to three different MonoBehaviour Components. The good news is that we have three possible methods through which we can find performance improvements, which means lots of opportunities to find code that can be improved. The bad news is that increasing the performance of one method will only improve about one-third of the total processing for that frame. Hence, all three methods may need to be examined and optimized in order get back under budget.
The GPU Usage Area
The GPU Usage Area is similar to the CPU Usage Area, except that it shows method calls and processing time as it occurs on the GPU. Relevant Unity method calls in this Area will relate to cameras, drawing, opaque and transparent geometry, lighting and shadows, and so on.
The GPU Usage Area offers hierarchical information similar to the CPU Usage Area and estimates time spent calling into various rendering functions such as Camera.Render() (provided rendering actually occurs during the frame currently selected in the Timeline View).
The Rendering Area
The Rendering Area provides some generic rendering statistics that tend to focus on activities related to preparing the GPU for rendering, which is a set of activities that occur on the CPU (as opposed to the act of rendering, which is activity handled within the GPU and is detailed in the GPU Usage Area). The Breakdown View offers useful information, such as the number of SetPass calls (otherwise known as Draw Calls), the total number of batches used to render the Scene, the number of batches saved from Dynamic Batching and Static Batching and how they are being generated, as well as memory consumed for textures.
The Memory Area
Simple mode provides only a high-level overview of memory consumption of subsystems. This include Unity's low-level Engine, the Mono framework (total heap size that is being watched by the Garbage Collector), graphical assets, audio assets and buffers, and even memory used to store data collected nby the Profiler.
Detailed mode shows memory consumption of individual GameObjects and MonoBehaviours for both their Native and Managed representations. It also has a column explaining the reason why an object may be consuming memory and when it might be deallocated
The Audio Area
The Audio Area grants an overview of audio statistics and can be used both to measure CPU usage from the audio system and total memory consumed by Audio Sources (both for those that are playing or paused) and Audio Clips.
The Breakdown View provides lots of useful insight into how the Audio System is operating and how various audio channels and groups are being used.
The Physics 3D and Physics 2D Areas
There are two different Physics Areas, one for 3D physics (Nvidia's PhysX) and another for the 2D physics system (Box2D). This Area provides various physics statistics, such as Rigidbody, Collider, and Contact counts
The Network Messages and Network Operations Areas
These two Areas provide information about Unity's Networking System, which was introduced during the Unity 5 release cycle. The information present will depend on whether the application is using the High-Level API (HLAPI) or Transport Layer API (TLAPI) provided by Unity. The HLAPI is a more easy-to-use system for managing Player and GameObject network synchronization automatically, whereas the TLAPI is a thin layer that operates just above the socket level, allowing Unity developers to conjure up their own networking system
The Video Area
If our application happens to make use of Unity's VideoPlayer API, then we might find this Area useful for profiling video playback behavior
The UI and UI Details Areas
These Areas are new in Unity 2017 and provide insight into applications making use of Unity's built-in User Interface System.
The Global Illumination Area
The Global Illumination Area is another new Area in Unity 2017, and gives us a fantastic amount of detail into Unity's Global Illumination (GI) system
Best approaches to performance analysis
Verifying script presence
Sometimes, there are things we expect to see, but don't. These are usually easy to spot because the human brain is very good at pattern recognition and spotting differences we didn't expect. Meanwhile, there are times where we assume that something has been happening, but it didn't. These are generally more difficult to notice, because we're often scanning for the first kind of problem, and we’re assuming that the things we don’t see are working as intended. In the context of Unity, one problem that manifests itself this way is
verifying that the scripts we expect to be operating are actually present in the Scene
Verifying script count
Preventing casual mistakes such as this is essential for good productivity, since experience tells us that if we don't explicitly disallow something, then someone, somewhere, at some point, for whatever reason, will do it anyway. This is likely to cost us a frustrating afternoon hunting down a problem that eventually turned out to be caused by human-error
Verifying the order of events
Unity applications mostly operate as a series of callbacks from Native code to Managed code
Minimizing ongoing code changes
Minimizing internal distractions
Vertical Sync (otherwise known as VSync) is used to match the application's frame rate to the frame rate of the device it is being displayed to, for example, a monitor may run at 60 Hertz (60 cycles per-second), and if a rendering loop in our game is running faster than this then it will sit and wait until that time has elapsed before outputting the rendered frame. This feature reduces screen-tearing which occurs when a new image is pushed to the monitor before the previous image was finished, and for a brief moment part of the
new image overlaps the old image.
Executing the Profiler with VSync enabled will probably generate a lot of noisy spikes in the CPU Usage Area under the WaitForTargetFPS heading, asthe application intentionally slows itself down to match the frame rate of the display. These spikes often appear very large in Editor Mode since the Editor is typically rendering to a very small window, which doesn’t take a lot of CPU or GPU work to render.
This will generate unnecessary clutter, making it harder to spot the real issue(s). We should ensure that we disable the VSync checkbox under the CPU Usage Area when we're on the lookout for CPU spikes during performance tests. We can disable the VSync feature entirely by navigating to Edit | Project Settings | Quality and then to the sub-page for the currently selected platform.
We should also ensure that a drop in performance isn't a direct result of a massive number of exceptions and error messages appearing in the Editor Console window. Unity's Debug.Log() and similar methods, such as Debug.LogError() and Debug.LogWarning() are notoriously expensive in terms of CPU usage and heap memory consumption, which can then cause garbage collection to occur and even more lost CPU cycles (refer to Chapter 8, Masterful Memory Management, for more information on these topics).
Minimizing external distractions
Targeted profiling of code segments
Profiler script control
The Profiler can be controlled in script code through the Profiler class
Custom CPU Profiling


using System;
using System.Diagnostics;

public class CustomTimer : IDisposable {
    private string _timerName;
    private int _numTests;
    private Stopwatch _watch;

    // give the timer a name, and a count of the
    // number of tests we're running
    public CustomTimer(string timerName, int numTests) {
        _timerName = timerName;
        _numTests = numTests;

        if (_numTests <= 0) {
            _numTests = 1;
        }

        _watch = Stopwatch.StartNew();
    }

    // automatically called when the 'using()' block ends
    public void Dispose() {
        _watch.Stop();
        float ms = _watch.ElapsedMilliseconds;
        UnityEngine.Debug.Log(string.Format("{0} finished: {1:0.00} " + "milliseconds total, {2:0.000000} milliseconds per-test " + "for {3} tests", _timerName, ms, ms / _numTests, _numTests));
    }
}

const int numTests = 1000;
using (new CustomTimer("My Test", numTests)) {
    for(int i = 0; i < numTests; ++i) {
        TestFunction();
    }
} // the timer's Dispose() method is automatically called here
There are three things to note when using this approach.
Firstly, we are onlymaking an average of multiple method invocations. If processing time varies enormously between invocations, then that will not be well represented in the final average.
Secondly, if memory access is common, then repeatedly requesting the same blocks of memory will result in an artificially higher cache hit rate (where the CPU can find data in memory very quickly because it's accessed the same region recently), which will bring the average time down when compared to a typical invocation.
Thirdly, the effects of Just-In-Time (JIT) compilation will be effectively hidden for similarly artificial reasons, as it only affects the first invocation of the method.
Unity has a significant startup cost when a Scene begins, given the amount of data that needs to be loaded from disk, the initialization of complex subsystems, such as the Physics and Rendering Systems, and the number of calls to various Awake() and Start() callbacks that need to be resolved before anything else can happen
Final thoughts on Profiling and Analysis
One way of thinking about performance optimization is the act of stripping away unnecessary tasks that spend valuable resources
Understanding the Profiler
Don't let the Profiler trick us into thinking that big spikes are always bad. As always, it's only important if the user will notice it
Reducing noise
The classical definition of noise (at least in the realm of computer science) is meaningless data, and a batch of profiling data that was blindly captured with no specific target in mind is always full of data that won't interest us. More sources of data takes more time to mentally process and filter, which can be very distracting. One of the best methods to avoid this is to simply reduce the amount of data we need to process by stripping away any data deemed nonvital to the current situation
Focusing on the issue
Focus is the skill of not letting ourselves become distracted by inconsequential tasks and wild goose chases
Summary
2. Scripting Strategies
In this chapter, we will explore ways of applying performance enhancements to the following areas:
- Accessing Components
- Component callbacks (Update(), Awake(), and so on)
- Coroutines
- GameObject and Transform usage
- Interobject communication
- Mathematical calculations
- Deserialization such as Scene and Prefab loading
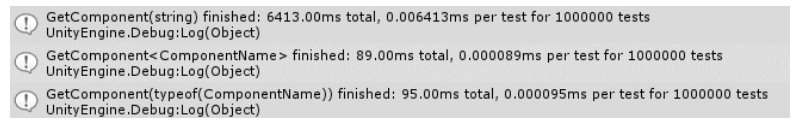
Obtain Components using the fastest method
Remove empty callback definitions
https://docs.unity3d.com/Manual/ExecutionOrder.html
However, it is important to realize that Unity will hook into these callbacks even if the function body is empty
Cache Component references
private Rigidbody rigidbody;

void Awake() {
    rigidbody = GetComponent<Rigidbody>();
}

void Update() {
    rigidbody.xxx;
}
Share calculation output
Update, Coroutines, and InvokeRepeating
Coroutines run on the main thread in a sequential manner such that only one Coroutine is handled at any given moment, and each Coroutine decides when to pause and resume via yield statements
Faster GameObject null reference checks
        if (!System.Object.ReferenceEquals(gameObject, null)) {
            // do something
        }
Avoid retrieving string properties from GameObjects

Use appropriate data structures
Avoid re-parenting Transforms at runtime
GameObject.Instantiate(Object original, Transform parent);

transform.hierarchyCapacity;
Consider caching Transform changes
Avoid Find() and SendMessage() at runtime
Assigning references to pre-existing objects
Static Classes
using UnityEngine;
public class EnemyCreatorComponent : MonoBehaviour {
    [SerializeField] private int _numEnemies;
    [SerializeField] private GameObject _enemyPrefab;
    [SerializeField] private EnemyManagerComponent _enemyManager;
    void Start() {
        for (int i = 0; i < _numEnemies; ++i) {
            CreateEnemy();
        }
    }
    p
  ublic void CreateEnemy() {
        _enemyManager.CreateEnemy(_enemyPrefab);
    }
}
Singleton Components
using UnityEngine;
public class SingletonComponent<T> : MonoBehaviour where T : SingletonComponent<T> {
    private static T __Instance;
    protected static SingletonComponent<T> _Instance {
        get {
            if (!__Instance) {
                T[] managers = GameObject.FindObjectsOfType(typeof(T)) as T[];
                if (managers != null) {
                    if (managers.Length == 1) {
                        __Instance = managers[0];
                        return __Instance;
                    } else if (managers.Length > 1) {
                        Debug.LogError("You have more than one " +
                        typeof(T).Name +
                        " in the Scene. You only need " +
                        "one - it's a singleton!");
                        for (int i = 0; i < managers.Length; ++i) {
                            T manager = managers[i];
                            Destroy(manager.gameObject);
                        }
                    }
                }

                GameObject go = new GameObject(typeof(T).Name, typeof(T));
                __Instance = go.GetComponent<T>();
                DontDestroyOnLoad(__Instance.gameObject);
            }
            return __Instance;
        }
        set {
            __Instance = value as T;
        }
    }
}

public class EnemyManagerSingletonComponent : SingletonComponent<EnemyManagerSingletonComponent>
    public static EnemyManagerSingletonComponent Instance {
        get { return ((EnemyManagerSingletonComponent)_Instance); }
        set { _Instance = value; }
    }

    public void CreateEnemy(GameObject prefab) {
        // same as StaticEnemyManager
    }

    public void KillAll() {
        // same as StaticEnemyManager
    }
}
A global Messaging System
public class Message {
    public string type;
    public Message() { type = this.GetType().Name; }
}
Moving on to our MessageSystem class, we should define its features by what kind of requirements we need it to fulfill:
- It should be globally accessible
- Any object (MonoBehaviour or not) should be able to register/deregister as linsteners to receive specific message types(that is, the Observer design pattern)
- Registering objects should provide a method to call when the given message is broadcasted from elsewhere
- The system should send the message to all listeners within a reasonable time frame, but not choke on too many requests at once
A globally accessible objectRegistration
Registration
public delegate bool MessageHandlerDelegate(Message message);
Message processing
Implementing the Messaging System
using System.Collections.Generic;
using UnityEngine;

public class MessagingSystem : SingletonComponent<MessagingSystem> {

    public static MessagingSystem Instance {
        get { return ((MessagingSystem)_Instance); }
        set { _Instance = value; }
    }

    private Dictionary<string, List<MessageHandlerDelegate>> _listenerDict = new Dictionary<string, List<MessageHandlerDelegate>>();

    public bool AttachListener(System.Type type, MessageHandlerDelegate handler) {
        if (type == null) {
            Debug.Log("MessagingSystem: AttachListener failed due to having no " +
            "message type specified");
            return false;
        }

        string msgType = type.Name;

        if (!_listenerDict.ContainsKey(msgType)) {
            _listenerDict.Add(msgType, new List<MessageHandlerDelegate>());
        }

        List<MessageHandlerDelegate> listenerList = _listenerDict[msgType];
        if (listenerList.Contains(handler)) {
            return false; // listener already in list
        }

        listenerList.Add(handler);

        return true;
    }
}
Message queuing and processing
private Queue<Message> _messageQueue = new Queue<Message>();

public bool QueueMessage(Message msg) {
    if (!_listenerDict.ContainsKey(msg.type)) {
        return false;
    }
    _messageQueue.Enqueu(msg);
    return true;
}

private const int _maxQueueProcessingTime = 16667;
private System.Diagnostics.Stopwatch timer = new System.Diagnostics.Stopwatch();

void Update() {
    timer.Start();
    while (_messageQueue.Count > 0) {
        if (_maxQueueProcessingTime > 0.0f) {
            if (timer.Elapsed.Milliseconds > _maxQueueProcessingTime) {
                timer.Stop();
                return;
            }
        }

        Message msg = _messageQueue.Dequeue();
        if (!TriggerMessage(msg)) {
            Debug.Log("Error when processing message: " + msg.type);
        }
    }
}

public bool TriggerMessage(Message msg) {
    string msgType = msg.type;

    if (!_listenerDict.ContainKey(msgType)) {
        Debug.Log("MessagingSystem: Message "" + msgType + "" has no listeners!");
        return false;
    }

    List<MessageHandlerDelegate> listenerList = _listenerDict[msgType];
    for (int i = 0; i < listenerList.Count; ++i) {
        if (listenerList[i](msg)) {
            return true;
        }
    }

    return true;
}
Implementing custom messages
public class CreateEnemyMessage : Message { }
public class EnemyCreatedMessage : Message {
    public readonly GameObject enemyObject;
    public readonly string enemyName;
    public EnemyCreatedMessage(GameObject enemyObject, string enemyName) {
        this.enemyObject = enemyObject;
        this.enemyName = enemyName;
    }
}
Message sending
public class EnemyCreatorComponent : MonoBehaviour {
    void Update() {
        if (Input.GetKeyDown(KeyCode.Space)) {
            MessagingSystem.Instance.QueueMessage(new CreateEnemyMessage());
        }
    }
}
Message registration
public class EnemyManagerWithMessagesComponent : MonoBehaviour {

    private List<GameObject> _enemies = new List<GameObject>();

    [SerializeField] private GameObject _enemyPrefab;

    void Start() {
        MessagingSystem.Instance.AttachListener(typeof(CreateEnemyMessage),this.HandleCreateEnemy);
    }

    bool HandleCreateEnemy(Message msg) {
        CreateEnemyMessage castMsg = msg as CreateEnemyMessage;
        string[] names = { "Tom", "Dick", "Harry" };
        GameObject enemy = GameObject.Instantiate(_enemyPrefab,5.0f * Random.insideUnitSphere,Quaternion.identity);
        string enemyName = names[Random.Range(0, names.Length)];
        enemy.gameObject.name = enemyName;
        _enemies.Add(enemy);
        MessagingSystem.Instance.QueueMessage(new EnemyCreatedMessage(enemy,enemyName));
        return true;
    }
}

public class EnemyCreatedListenerComponent : MonoBehaviour {

    void Start() {
        MessagingSystem.Instance.AttachListener(typeof(EnemyCreatedMessage),
        HandleEnemyCreated);
    }

    bool HandleEnemyCreated(Message msg) {
        EnemyCreatedMessage castMsg = msg as EnemyCreatedMessage;
        Debug.Log(string.Format("A new enemy was created! {0}", castMsg.enemyName));
        return true;
    }
}
Message cleanup
public bool DetachListener(System.Type type, MessageHandlerDelegate handler) {
    if (type == null) {
        Debug.Log("MessagingSystem: DetachListener failed due to having no " + "message type specified");
        return false;
    }

    string msgType = type.Name;

    if (!_listenerDict.ContainsKey(type.Name)) {
        return false;
    }

    List<MessageHandlerDelegate> listenerList = _listenerDict[msgType]; if (!listenerList.Contains(handler)) {
        return false;
    }

    listenerList.Remove(handler);
    return true;
}

void OnDestroy() {
    if (MessagingSystem.IsAlive) {
        MessagingSystem.Instance.DetachListener(typeof(EnemyCreatedMessage),this.HandleCreateEnemy);
    }
}
Wrapping up the Messaging System
Disable unused scripts and objects
Disabling objects by visibility
void OnBecameVisible() { enabled = true; }
void OnBecameInvisible() { enabled = false; }

void OnBecameVisible() { gameObject.SetActive(true); }
void OnBecameInvisible() { gameObject.SetActive(false); }
Disabling objects by distance
[SerializeField] GameObject _target;
[SerializeField] float _maxDistance;
[SerializeField] int _coroutineFrameDelay;

void Start() {
    StartCoroutine(DisableAtADistance());
}

IEnumerator DisableAtADistance() {
    while (true) {
        float distSqrd = (transform.position - _target.transform.position).sqrMagnitude;

        if (distSqrd < _maxDistance * _maxDistance) {
            enabled = true;
        } else {
            enabled = false;
        }

        for(int i = 0; i < _coroutineFrameDelay; ++i) {
            yield return new WaitForEndOfFrame();
        }
    }
}
Consider using distance-squared over distance
Minimize Deserialization behavior
Unity's Serialization system is mainly used for Scenes, Prefabs,ScriptableObjects and various Asset types(which tend to derive from ScriptableObject).
When one of these object types is saved to disk, it is converted into a text file using the Yet Another Markup Language (YAML) format, which can be deserialized back into the original object type at a later time.
All GameObjects and their properties get serialized when a Prefab or Scene is serialized, including private and protected fields, all of their Components as well as its child GameObjects and their Components, and so on.
When our application is built, this serialized data is bundled together in large binary data files internally called Serialized Files in Unity.
Reading and deserializing this data from disk at runtime is an incredibly slow process (relatively speaking) and so all deserialization activity comes with a significant performance cost.
This kind of deserialization takes place any time we call Resources.Load() for a file path found under a folder named Resources.
Once the data has been loaded from disk into memory, then reloading the same reference later is much faster, but disk activity is always required the first time it is accessed.
Naturally, the larger the data set we need to deserialize, the longer this process takes.
Since every Component of a Prefab gets serialized, then the deeper the hierarchy is, the more data needs to be deserialized.
This can be a problem for Prefabs with very deep hierarchies, Prefabs with many empty GameObjects (since every GameObject always contains at least a Transform Component), and particularly problematic for User Interface(UI) Prefabs, since they tend to house many more Components than a typical Prefab.
Loading in large serialized data sets like these could cause a significant spike in CPU the first time they are loaded, which tend to increase loading time if they're needed immediately at the start of the Scene.
More importantly, they can cause frame drops if they are loaded at runtime.
There are a couple ofapproaches we can use to minimize the costs of deserialization.
Reduce serialized object size
Load serialized objects asynchronously
Keep previously loaded serialized objects in memory
Move common data into ScriptableObjects
Load scenes additively and asynchronously
Create a custom Update() layer
Earlier in this chapter, in the "Update, Coroutines and InvokeRepeating" section, we discussed the relative pros and cons of using these Unity Engine features as a means of avoiding excessive CPU workload during most of our frames.
Regardless of which of these approaches we might adopt, there is an additional risk of having lots of MonoBehaviours written to periodically call some function, which is having too many methods triggering in the same frame simultaneously.
Imagine thousands of MonoBehaviours that initialized together at the start of a Scene, each starting a Coroutine at the same time that will process their AI tasks every 500 milliseconds.
It is highly likely that they would all trigger within the same frame, causing a huge spike in its CPU usage for a moment, which settles down temporarily and then spikes again a few moments later when the next round of AI processing is due.
Ideally, we would want to spread these invocations out over time.
The following are the possible solutions to this problem: Generating a random time to wait each time the timer expires or Coroutine triggers Spread out Coroutine initialization so that only a handful of them are started at each frame Pass the responsibility of calling updates to some God Class that places a limit on the number of invocations that occur each frame
The first two options are appealing since they’re relatively simple and we know that Coroutines can potentially save us a lot of unnecessary overhead.
However, as we discussed, there are many dangers and unexpected side effects associated with such drastic design changes.
A potentially better approach to optimize updates is to not use Update() at all, or more accurately, to use it only once.
When Unity calls Update(), and in fact, any of its callbacks, it crosses the aforementioned Native-Managed Bridge,which can be a costly task.
In other words, the processing cost of executing 1,000 separate Update() callbacks will be more expensive than executing one Update() callback, which calls into 1,000 regular functions.
As we witnessed in the "Remove empty callback definitions" section, calling Update() thousands of times is not a trivial amount of work for the CPU to undertake, primarily because of the Bridge.
We can, therefore, minimize how often Unity needs to cross the Bridge by having a God Class MonoBehaviour use its own Update() callback to call our own custom updatestyle system used by our custom Components.
In fact, many Unity developers prefer implementing this design right from the start of their projects, as it gives them finer control over when and how updates propagate throughout the system; this can be used for things such as menu pausing, cool time manipulation effects, or prioritizing important tasks and/or suspending low priority tasks if we detect that we’re about to reach our CPU budget for the current frame.
All objects wanting to integrate with such a system must have a common entry point.
We can achieve this through an Interface Class with the interface keyword.
Interface Classes essentially set up a contract whereby any class that implements the Interface Class Class must provide a specific series of methods.
In other words, if we know the object implements an Interface Class, then we can be certain about what methods are available.
In C#, classes can only derive from a single base class, but they can implement any number of Interface Classes (this avoids the deadly diamond of death problem that C++ programmers will be familiar with).
The following Interface Class definition will suffice, which only requires the implementing class to define a single method called OnUpdate():
public interface IUpdateable {
void OnUpdate(float dt);
}
It’s common practice to start an Interface Class definition with a capital ‘I’ to make it clear that it is an Interface Class we’re dealing with.
The beauty of Interface Classes is that they improve the decoupling of our codebase, allowing huge subsystems to be replaced, and as long as the Interface Class isadhered to, we will have greater confidence that it will continue to function as intended.
Next, we'll define a custom MonoBehaviour type which implements this Interface Class:
public class UpdateableComponent : MonoBehaviour, IUpdateable {
public virtual void OnUpdate(float dt) {}
}
Note that we're naming the method OnUpdate() rather than Update().
We're defining a custom version of the same concept, but we want to avoid name collisions with the built-in Update() callback.
The OnUpdate() method of the UpdateableComponent class retrieves the current delta time (dt), which spares us from a bunch of unnecessary Time.deltaTime calls, which are commonly used in Update() callbacks.
We've also made the function virtual to allow derived classes to customize it.
This function will never be called as it's currently being written.
Unity automatically grabs and invokes methods defined with the Update() name, but has no concept of our OnUpdate() function, so we will need to implement something that will call this method when the time is appropriate.
For example, some kind of GameLogic God Class could be used for this purpose.
During the initialization of this Component, we should do something to notify our GameLogic object of both its existence and its destruction so that it knows when to start and stop calling its OnUpdate() function.
In the following example, we will assume that our GameLogic class is a SingletonComponent, as defined earlier in the "Singleton Components" section, and has appropriate static functions defined for registration and deregistration.
Bear in mind that it could just as easily use the aforementioned MessagingSystem to notify the GameLogic of its creation/destruction.
For MonoBehaviours to hook into this system, the most appropriate place is within their Start() and OnDestroy() callbacks:
void Start() {
GameLogic.Instance.RegisterUpdateableObject(this);
}
void OnDestroy() {
if (GameLogic.Instance.IsAlive) {
GameLogic.Instance.DeregisterUpdateableObject(this);
}
}
It is best to use the Start() method for the task of registration, since using Start() means that we can be certain all other pre-existing Components will have at least had their Awake() methods called prior to this moment.
This way, any critical initialization work will have already been done on the object before we start invoking updates on it.
Note that because we're using Start() in a MonoBehaviour base class, if we define a Start() method in a derived class, it will effectively override the base class definition, and Unity will grab the derived Start() method as a callback instead.
It would, therefore, be wise to implement a virtual Initialize() method so that derived classes can override it to customize initialization behavior without interfering with the base class's task of notifying the GameLogic object of our Component's existence.
The following code provides an example of how we might implement a virtual Initialize() method.
void Start() {
GameLogic.Instance.RegisterUpdateableObject(this);
Initialize();
}
protected virtual void Initialize() {
// derived classes should override this method for initialization code, and NOT reimple
}
Finally, we will need to implement the GameLogic class.
The implementation is effectively the same whether it is a SingletonComponent or a MonoBehaviour, and whether or not it uses the MessagingSystem.
Either way, our UpdateableComponent class must register and deregister as IUpdateable objects, and the GameLogic class must use its own Update() callback to iterate through every registered object and call their OnUpdate() function.
Here is the definition for our GameLogic class:
public class GameLogicSingletonComponent : SingletonComponent<GameLogicSingletonComponent> {
public static GameLogicSingletonComponent Instance {
get { return ((GameLogicSingletonComponent)_Instance); }
set { _Instance = value; }
}
List<IUpdateable> _updateableObjects = new List<IUpdateable>();
public void RegisterUpdateableObject(IUpdateable obj) {
if (!_updateableObjects.Contains(obj)) {
_updateableObjects.Add(obj);
}
}
public void DeregisterUpdateableObject(IUpdateable obj) {
if (_updateableObjects.Contains(obj)) {
_updateableObjects.Remove(obj);
}
}
void Update() {
float dt = Time.deltaTime;
for (int i = 0; i < _updateableObjects.Count; ++i) {
_updateableObjects[i].OnUpdate(dt);
}
}
}
If we make sure that all of our custom Components inherit from the UpdateableComponent class, then we've effectively replaced "N" invocations of the Update() callback with just one Update() callback, plus "N" virtual function calls.
This can save us a large amount of performance overhead because even though we're calling virtual functions (which cost a small overhead more than a non-virtual function call because it needs to redirect the call to the correct place), we're still keeping the overwhelming majority of update behavior inside our Managed code and avoiding the Native-Managed Bridge as much as possible.
This class can even be expanded to provide priority systems, to skip low-priority tasks if it detects that the current frame has taken too long, and many other possibilities.
Depending on how deep you already are into your current project, such changes can be incredibly daunting, time-consuming, and likely to introduce a lot of bugs as subsystems are updated to make use of a completely different set of dependencies.
However, the benefits can outweigh the risks if time is on your side.
It would be wise to do some testing on a group of objects in a Scene that is similarly designed to your current Scene files to verify that thebenefits outweigh the costs.
Summary
3. The Benefits of Batching
In 3D graphics and games, batching is a very general term describing the process of grouping a large number of wayward pieces of data together and processing them as a single, large block of data. This situation is ideal for CPUs, and particularly GPUs, which can handle simultaneous processing of multiple tasks with their multiple cores. Having a single core switching back and forth between different locations in memory takes time, so the less this needs to be done, the better.
In some cases, the act of batching refers to large sets of meshes, vertices, edges, UV coordinates, and other different data types that are used to represent a 3D object. However, the term could just as easily refer to the act of batching audio files, sprites, texture files, and other large datasets.
So, just to clear up any confusion, when the topic of batching is mentioned in Unity, it is usually referring to the two primary mechanisms it offers for batching mesh data: Dynamic Batching and Static Batching. These methods are essentially two different forms of geometry merging, where we combine mesh data of multiple objects together and render them all in a single instruction, as opposed to preparing and drawing each one separately.
The process of batching together multiple meshes into a single mesh is possible because there is no reason a mesh object must fill a contiguous volume of 3D space. The Rendering Pipeline is perfectly happy with accepting a collection of vertices that are not attached together with edges, and so we can take multiple separate meshes that might have resulted in multiple render instructions and combine them together into a single mesh, thus rendering it out using a single instruction.
We will cover the following topics in this chapter:
- A brief introduction to the Rendering Pipeline and the concept of Draw Calls
- How Unity's Materials and Shaders work together to render our objects
- Using the Frame Debugger to visualize rendering behavior
- How Dynamic Batching works, and how to optimize it
- How Static Batching works, and how to optimize it
Draw Calls
The primary goal of these batching methods is to reduce the number of Draw Calls required to render all objects in the current view. At its most basic form, a Draw Call is a request sent from the CPU to the GPU asking it to draw an object
Draw Call is the common industry vernacular for this process, although they are sometimes referred to as SetPass Calls in Unity, since some low-level methods are named as such
This utterly massive array of settings that must be configured to prepare the Rendering Pipeline just prior to rendering an object is often condensed into a single term known as the Render State.Until these Render State options are chagned, the GPU will maintain the same Render State for all incoming objects and render them in a similar fashion
Changing the Render State can be a time-consuming process. So, for exmpale, if we were to set the Render State to use a blue texture file and then ask it to render one gigantic mesh, then it would be rendered very rapidly with the whole mesh appearing blue. We could then render 9 more, completely different meshes, and they would all be rendered blue, since we haven't changed which texture is being used. If, however, we wanted to rendedr 10 meshes using 10 different textures, then this will take longer. This is because we will need to prepare the Render State with the new texture just prior to sending the Draw Call instruction for each mesh.
The texture being used to render the current object is effectively a global variable in the Graphics API, and changing a global variable within a parallel system is much easier said than done. In a massively parallel system such as a GPU, we must effectively wait until all of the current jobs have reached the same synchronization point(in other words, the fastest cores need to stop and wait for the slowest ones to catch up, wasting processing time that they could be using on other tasks) before we can make a Render State change, at which point we weill need to spin up all of the parallel jobs agian. This can waste a lot of time, so the less we need to ask the Render State to change, the faster the Graphics API will be able to proces our requests
Things that can trigger Render State synchronization include--but are not limited to--an immediate push of a new texture to the GPU and changing a Shader, lighting information, shadows, transparency, and pretty much any graphical setting we can think of.
Once the Render State is configured, the CPU must decide what mesh to draw, what textures and Shader it should use, and where to draw the object based on its position, rotation, and scale(all represented within a 4x4 matrix known as a transform, which is where the Transform Component gets its name from) and then send an instruction to the GPU to draw it. In order to keep the communication between CPU and GPU very dynamic, new instructions are pushed into a queue known as the Command Buffer. This queue contains instructions that the CPU has created and that the GPU pulls from each time it finishes the preceding command.
The trick to how batching improves the performance of this process is that a new Draw Call does not necessarily mean that a new Render State must be configured. If two objects share the exact same Render State information, then the GPU can immediately begin rendering the new object since the same Render State is maintained after the last object is finished. This eliminates the time wasted due to a Render State synchronization. It also serves to reduce the number of instructions that need to be pushed into the Command Buffer, reducing the workload on both the CPU and GPU.
Materials and Shaders
Render State in Unity is essentially exposed to us via Materials
If we want to minimize how often the Render State changes, then we can do so by reducing the number of Materials we use during a Scene. This would result in two performance improvements simultaneously; the CPU will spend less time generating and transmitting instructions to the GPU each frame and the GPU won't need to stop and re-synchronize state changes as often
Before we start, we should disable a few rendering options as they will contribute some extra Draw Calls, which might be distracting
- Window->Lighting->Scene->Environment-> set Skybox Material to null
- Edit->Project Settings->Quality-> set Shadows to Disable Shadows
- Edit->Project Settings->Player->Other Settings-> disable Static Batching and Dynamic Batching
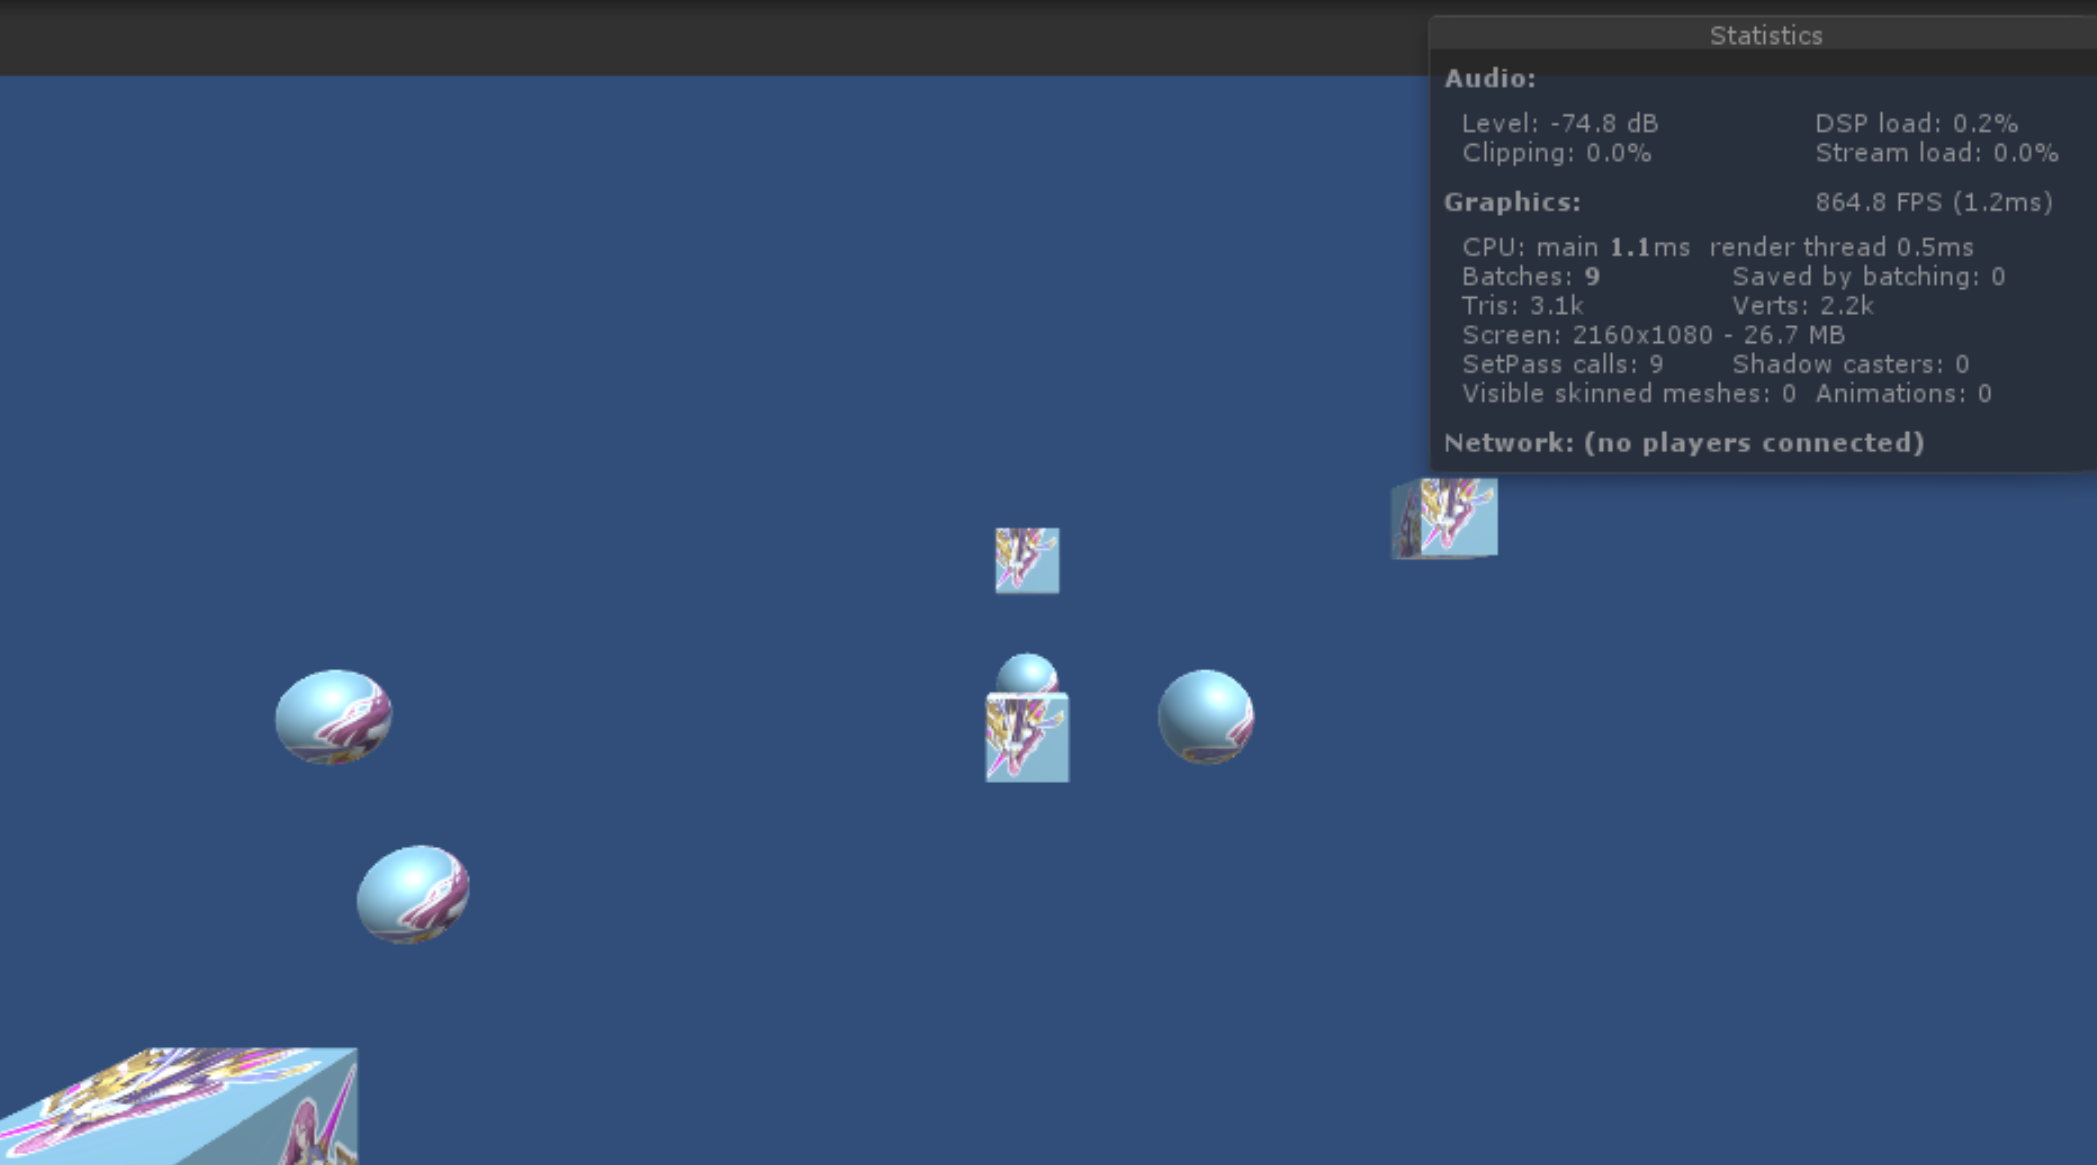
We can see 9 total batches. This value closely represents the number of Draw Calls used to render the Scene. The current view will consume one of these batches rendering the background of the scene, which could be set to Skybox or Solid Color.
The remainng 8 batches are used to draw out 8 objects. In each case, the Draw Call involves preparing the Rendering Pipeline using the Material's properties and asking the GPU to render the given mesh at its current transform.
We have ensured that each Material is unique by giving them each a unique texture file to render. Ergo, each mesh requires a different Render State, and, therefore, each of our 8 meshes requires a unique Draw Call
As previously mentioned, we can theoretically minimize the number of Draw Calls by reducing how often we cause the system to change Render State information. So, part of the goal is to reduce the amount of Materials we use.
However, if we set all objects to use the same Material, we still won't see any benefit and the number of batches remains at 9:

This is because we're not actually reducing the number of Render State changes nor efficiently grouping mesh information. Unfortunately, the Rendering Pipeline is not smart enough to realize we're overwriting the exact same Render State values, and then asking it to render the same meshes, over and over again.
The Frame Debugger

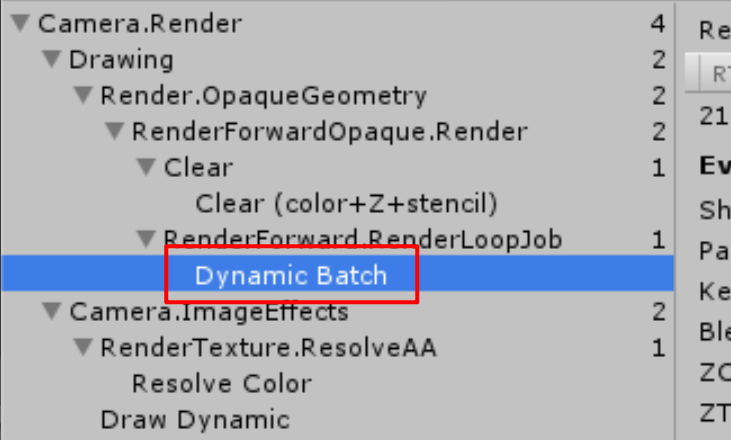
Drawing section which lists all of the Draw Calls in our Scene.
One Draw Call is being consumed to clear the screen (the item labelled Clear). and then our 8 meshes are being rendered in 8 separate Draw Calls (the item labelled RenderForward.RenderLoopJob)
Note that the number next to each item in the left-hand panel actually represents a Graphics API call, of which a Draw Call is but one type of API call. These can be seen in the Camera.Render, Camera.ImageEffects and RenderTexture.ResolveAA items. Any API call can be just as costly as a Draw Call, but the overwhelming majority of API calls we will make in a complex Scene is in the form of Draw Calls, so it is often best to focus on minimizing Draw Calls before worrying about the API communication overhead of things such as post-processing effects.
Dynamic Batching
Dynamic Batching has the following three important qualities:
- Batches are generated at runtime (batches are dynamically generated)
- The objects that are contained within a batch can vary from one frame to the next, depending on what meshes are currently visible to the Main Camera view(batch contents are dynamci)
- Even objects that can move around the Scene can be batched (it works on dynamic objects)
Hence, these attributes lead us to the name Dynamic Batching
Player Settings-> enable Dynamic Batching
Dynamic Batching automatically recognizes that our objects share Material and mesh information and is, therefore, combining some of them into a larger batch for processing.
The four spheres do not fit the requirements of Dynamic Batching. Despite the fact that they all use the same Material, there are many more requirements we must fulfill
https://docs.unity3d.com/Manual/DrawCallBatching.html
https://blogs.unity3d.com/2017/04/03/how-to-see-why-your-draw-calls-are-not-batched-in-5-6/
The following list covers the requirements to enable Dynamic Batching for a given mesh:
- All mesh instances must use the same Material reference
- Only ParticleSystem and MeshRenderer Components are dynamically batched. SkinnedMeshRenderer Components (for animated characters) and all other renderable Component types cannot be batched
- There is a limit of 300 vertices per mesh
- The total number of vertex attributes used by the Shader must be no greater than 900
- Either all mesh instances should use a uniform scale or all meshes should use a nonuniform scale, but not mixture of the two
- Mesh instances should refer to the same Lightmap file
- The Material's Shader should not depend on multiple passes
- Mesh instances must nopt receive real-time shadows
- There is an upper limit on the total number of mesh indices in the entire batch, which varies per-Graphics API and platform used, which is around 32k-64k indices
It is important to note the term Material references, because if we happen to use two different Materials with identical settings, the Rendering Pipeline is not smart enough to realize that, and they will be treated as different Materials and, therefore, will be disqualified from Dynamic Batching. Most of the rest of these requirements have either already been explained; however, a couple of these requirements are not completely intuitive or clear from the description, which merits additional explanation.
Vertex attributes
A vertex attribute is simply a piece of information contained within a mesh file on a per-vertex basis, and each is normally represented as a group of multiple floating-point values. This includes, but is not limited to, a vertex's position (relative to the root of the mesh), a normal vector (a vector pointing away from the object's surface, most often used in lighting calculations), one or more sets of texture UV coordinates (used to define how one or more textures wrap around the mesh), and possibly even color information per-vertex (normally used in custom lighting or for a flat-shaded, low-poly style object). Only meshes with less than 900 total vertex attributes used by the Shader can be included in Dynamic Batching.
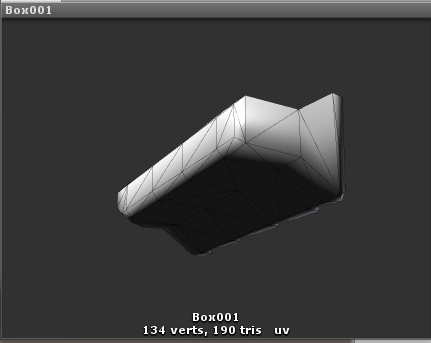
Note that looking into a mesh's raw data file may contain less vertex attribute information than what Unity loads into memory because of how the engine converts mesh data from one of several raw data formats into an internal format. So, don't assume that the number of attributes our 3D modeling tool tells us the mesh uses will be the final count. The best way to verify the attribute count is to either drill down into the mesh object in the Project window until you find the MeshFilter Component and look at the verts value that appears in the Preview subsection of the Inspector window
Using more attribute data per vertex within the accompanying Shader will consume more from our 900-attribute budget and hence reduce the number of vertices the mesh is allowed to have before it can no longer be used in Dynamic Batching. For example, a simple diffuse Shader might only use 3 attributes per-vertex: position, normal, and a single set of UV coordinates. Dynamic Batching would therefore be able to support meshes using this Shader, which have a combined total of 300 vertices. However, a more complex Shader, requiring 5 attributes per-vertex, would only be able support Dynamic Batching with meshes using no more than 180 vertices. Also, note that even if we are using less than 3 vertex attributes per vertex in our Shader, Dynamic Batching still only supports meshes with a maximum of 300vertices, so only relatively simple objects are candidates for Dynamic Batching
Mesh scaling
Dynamic Batching summary
Dynamic Batching is a very useful tool when we want to render very large groups of simple meshes. The design of the system makes it ideal to use when we're making use of large numbers of simple meshes, which are nearly identical in appearance. Possible situations to apply Dynamic Batching could be as follows:
- A large forest filled with rocks, trees, and bushes
- A building, factory, or space station with many simple, common elements (computers, corridor pieces, pipes, and so on)
- A game featuring many dynamic, non-animated objects with simple geometry and particle effects (a game such as Geometry Wars springs to mind)
If the only requirement preventing two objects from being Dynamically Batched together is the fact that they use different texture fiels, be aware that it only takes a bit of development time and effort to combine textures, and regenerate mesh UVs so that they can be Dynamically Batched together (commonly known as Atlasing). This may cost us in texture quality or the overall size of a texture file (which can have drawbacks we will understand once we dive into the topic of GPU Memory Bandwith in Chapter 6, Dynamic Graphics), but it is worth considering.
Perhaps the only situation where Dynamic Batching may be a detriment on performance is if we were to set up a Scene with hundreds of simple objects, where only a few objects are put into each batch. In these cases, the overhead cost of detecting and generating so many small batches might cost more time than we'd save by just making a separate Draw Call for each mesh. Even still, this is unlikely
If anyting, we're far more likely to inflict performance losses on our application by simply assuming that Dynamic Batching is taking place, when we've actually forgotten one of the essential requirements. We can accidentally break the vertex limit by pushing a new version of a mesh, and in the process of Unity converting a raw Object(with the .obj extension) file into its own internal format, it generates more some Shader code or adding additional passes without realizing it would disqualify it from Dynamic Batching. We might even set up the object to enable shadows or Light Probes, which breaks another requirement.
Ultimately, every situation is unique, so it is worth experimenting with our mesh data, Materials, and Shaders to determine what can and cannot be dynamically batched, and performing some testing in our Scene from time to time to ensure that the number of Draw Calls we're using remains reasonable.
Static Batchings
The Static Batching system has its own set of requirements:
- As the name implies, the meshes must be flagged as Static (specifically, Batching Static)
- Additional memory must be set aside for each mesh being statically batched
- There is an upper limit on the number of vertices that can be combined in a static batch that varies per Graphic API and platform, which is around 32k-64k vertices
- The mesh instances can come from any source mesh, but they must share the same Material reference
The Static flag
Static Batching can only be applied to objects with the static flag enabled or, more specifically, the Batching Static subflag(these subflags are known as StaticEditorFlags). Clicking on the small down-pointing arrow next to the Static option for a GameObject will reveal a dropdown of the StaticEditorFlags, which can alter the object's behaviour for various Static processes.
An obvious side effect of this is that the object's transform cannot be changed, and, hence, any object wishing to make use of Static Batching cannot be moved, rotated, or scaled in any way
Memory requirements
The addtional memory requirement for Static Batching will vary, depending on the amount of replication occuring within the batched meshes. Static Batching works by copying the data for all flagged and visible meshes into a single, large mesh data buffer, and passing it into the Rendering Pipeline through a single Draw Call, while ignoring the original mesh. If all of the meshes being statically batched are unique, then this would cost us no addtional memory usage compared to rendering the objects normally, as the same amount of memory space is required to store the meshes.
However, since the data is effectively copied, these statically batched duplicates cost us addtional memroy equal to the number of meshes, multiplied by the size of the original mesh. Ordinarily, rendering one, ten, or a million clones of the same object costs us the same amount of memroy, because they're all referencing the same mesh data. The only difference between objects in this case is the transform of each object. However, because Static Batching needs to copy the data into a large buffer, this referencing is lost, since each duplicate of the original mesh is copied into the buffer with a unique set of data with a hardcoded transform baked into the vertex positions.
Therefore, using Static Batching to render 1000 identical tree objects will cost us 1000 times more memory than rendering the same trees without Static Batching. This causes some significatn memroy consumption and performance issues if Static Batching is not used wisely.
Material references
We are already aware that sharing Material references is a means of reducing Render State changes, so this requirement is fairly obvious. In addtion, sometimes, we statically batch meshes that require multiple Materials. In this case, all meshes using a different Material will be grouped together in their own static batch and for each unique Material being used.
The downside to this requirement is that, at best, Static Batching can only render all of the static meshes using a number of Draw Calls equal to the number of Materials they need.
Static Batching caveats
The Static Batching system has some addtional drawbacks. Owing to how it approaches the batching solution, by combining meshes into a single greater mesh, the Static Batching system has a few caveats that we need to be aware of.These concerns range from minor inconveniences to major drawbacks, depending on the Scene:
- Draw Call savings are not immediately visible from the Stats window until runtime
- Objects marked Batching Static introduced in the Scene at runtime will not be automatically included in Static Batching
Edit Mode debugging of Static Batching
Instantiating static meshes at runtime
Any new objects we add into the Scene at runtime will not be automatically combined into any existing batch by the Static Batching system, even if they were marked as Batching Static. To do so would cause an enormous runtime overhead between recalculating the mesh and synchronizing with the Rendering Pipeline, so Unity does not even attempt to do it automatically
For the most part, we should try to keep any meshes we want to be statically batched present in the original Scene file. However, if dynamic instantiation is necessary, or we are making use of additive Scene loading, then wen can control static batch eligibility with the StaticBatchUntility.Combine() method. This utility method has two overloads: either we provide a root GameObject, in which case all child GameObjects with meshes will be truned into new static batch groups (multiple could be created if they share multiple Materials) or we provide a list of GameObjects and a root GameObject, and it will automatically attach them as children to the root and generate new static batch groups in the same manner
We should profile our usage of this function, as it can be quite an expensive operation if there are many vertices to combine. It will also not combine the given meshes with any preexisting statically batched groups, even if they share the same Material. So we will not be able to save Draw Calls by instantiating or additively loading Static meshes that use the same Material as other statically batched groups already present in the Scene (it can only combine with meshes it was grouped with in the Combine() call)
Note that if any of the GameObjects we batch with the StaticBatchUtility.Combine() method are not marked as Static before batching, the GameObjects will remain non-Static, but the mesh itself will be Static. This means that we could accidentally move the GameObject, its Collider Component, and any other important objects, but the mesh will remain in the same location. Be careful about accidentally mixing Static and non-Static states in statically batched objects.
Static Batching summary
Static Batching is a powerful, but dangerous tool. If we don't use it wisely, we can vary easily inflict enormous performance losses via memory consumption(potentially leading to application crashes) and rendering costs on our application. It also takes a good amount of manual tweaking and configuration to ensure that batches are being properly generated, and that we aren't accidentally introducing any unintended side effects of using various Static flags. However, it does have a significant advantage in that it can be used on meshes of different shapes and enormous sizes, which Dynamic Batching cannot provide.
Summary
It is clear that the Dynamic Batching and Static Batching systems are not a silver bullet. We cannot blindly apply them to any given Scene and expect improvements. If our application and Scene happen to fit a particular set of parameters, then these methods are very effective at reducing CPU load and redering bottlenecks. However, if not, then some addtional work is required to prepare our Scene to meet batching feature requirements. Ultimately, only a good understanding of these batching systems and how they function can help us determine where and when this feature can be applied, and, hopefully, this chapter has given us all of the information we need to make informed decisions.
4. Kickstart Your Art
Audio
Importing audio files
Loading audio files
Encoding formats and quality levels
Audio performance enhancements
Minimize active Audio Source count
Enable Force to Mono for 3D sounds
Resample to lower frequencies
Consider all compression formats
Beware of streaming
Apply Filter Effects through Mixer Groups to reduce duplication
Use remote content streaming responsibly
Consider Audio Module files for background music
Texture files
The terms texture and sprite often get confused in game development, so it's worth making the distinction--a texture is simply an image file, a big list of color data telling the interpreting program what color each pixel of the image should be, whereas a sprite is the 2D equivalent of a mesh, which is often just a single quad(a pair of triangles combined to make a rectangular mesh) that renders flat against the current Camera.
There are also things called Sprite Sheets, which are large collections of individual images contained within a larger texture file, commonly used to contain the animations of a 2D character.
These files can be split apart by tools, such as Unity's Sprite Atlas tool, to form individual textures for the character's animated frames.
Both meshes and sprites use textures to render an image onto its surface.
Texture image files are typically generated in tools such as Adobe Photoshop or Gimp and then imported into our project in much the same way as audio files.
At runtime, these files are loaded into memory, pushed to the GPU's VRAM, and rendered by a Shader over the target sprite or mesh during a given Draw Call.
Texture compression formats
Texture performance enhancements
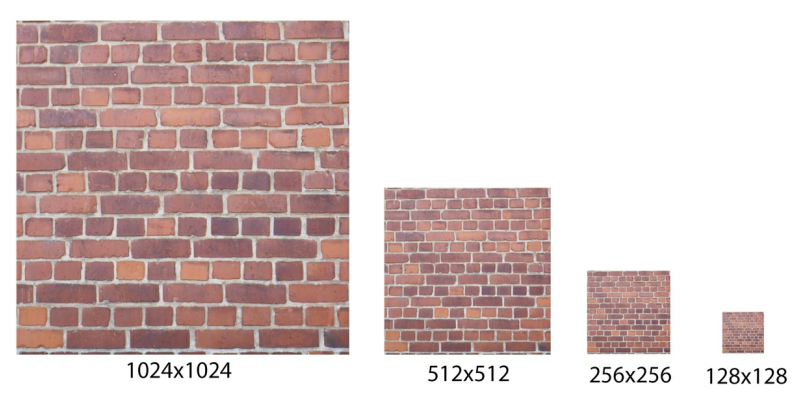
Reduce texture file size
The larger a given texture file, the more GPU Memory Bandwidth will be consumed, pushing the texture when it is needed. If the total memory pushed per second exceeds the graphics card's total Memory Bandwidth, then we will have a bottleneck, as the GPU must wait for all textures to be uploaded before the next rendering pass can begin. Smaller textures are naturally easier to push through the pipeline than larger textures, so we will need to find a good middle ground between high quality and performance.
A simple test to find out if we're bottlenecked in Memory Bandwidth is to reduce the resolution of our games most abundant and largest texture files and relaunch the Scene. If the frame rate suddenly improves, then the application was most likely bound by texture throughput. If the frame rate does not improve or improves very little, then either we still have some Memory Bandwidth to make use of or there are bottlenecks elsewhere in the Rendering Pipeline, preventing us from seeing any further improvement
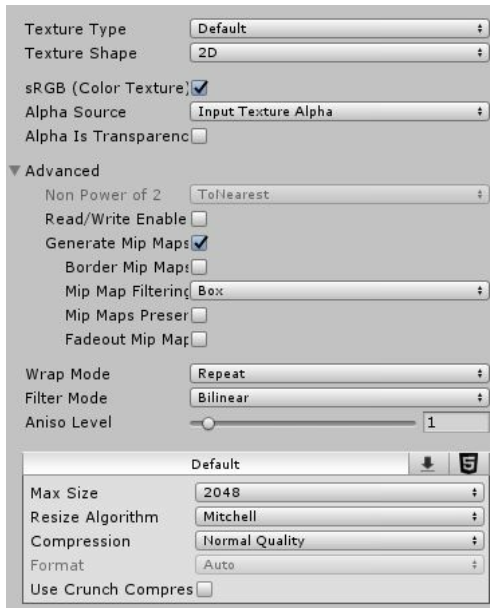
Use Mip Maps wisely

These images will be packed together to save space, essentially creating a final texture file that will be about 33 percent larger than the original image. This will cost some disk space and GPU Memory Bandwidth to upload
Remember that Mip Mapping is only useful if we have textures that need to be rendered at varying distances from the Camera
Manage resolution downscaling externally
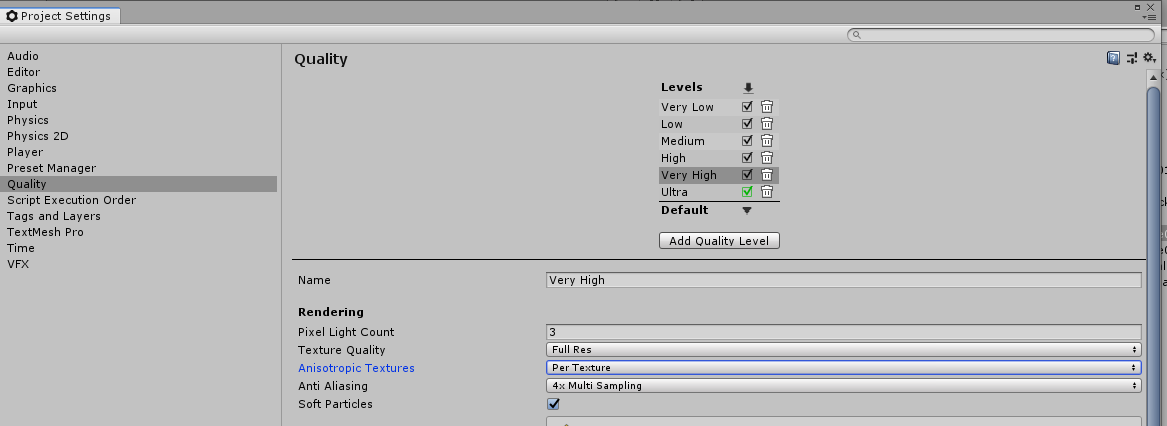
Adjust Anisotropic Filtering levels
Anisotropic Filtering is a feature that improves the image quality of textures when they are viewed at very oblique (shallow) angles

Much like Mip Mapping, this effect can be costly and, sometimes,unnecessary
Consider Atlasing
Atlasing is the technique of combining lots of smaller, isolated textures together into a single, large texture file in order to minimize the number of Materials, and hence Draw Calls, we need to use
Each unique Material will require an additional Draw Call, but each Material only supports a single primary texture
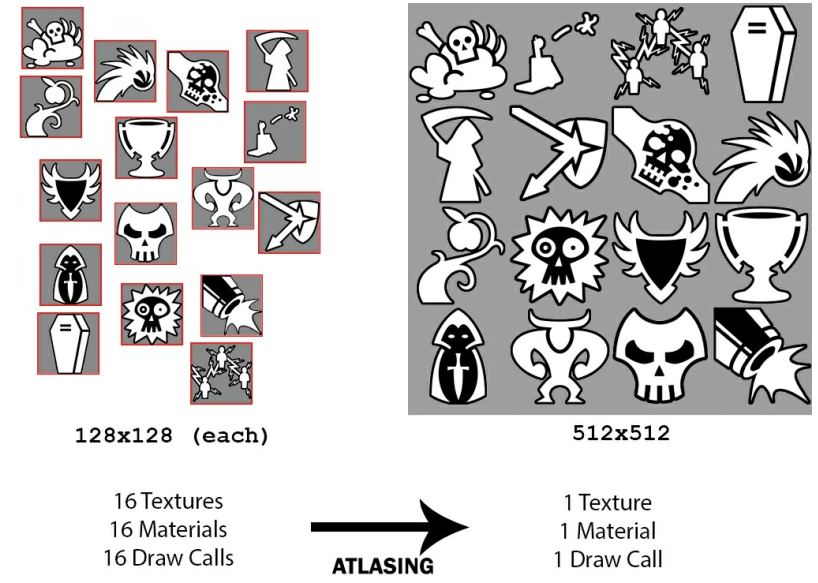
Extra work is required to modify the UV coordinates used by the mesh or sprite object to only sample the portion of the larger texture file that it needs, but the benefits are clear; reducing Draw Calls results in reduction of CPU workload and improvement in the frame rate if our application isbottlenecked on CPU. Note that Atlasing does not result in reduced Memory Bandwidth consumption since the amount of data being pushed to the GPU would also be identical. It just happens to be bundled together in one bigger texture file
Atlasing is only an option when all of the given textures require the same Shader. If some of the textures need unique graphical effects applied through Shaders, then they must be isolated into their own Materials and Atlased in separate groups
However, because Dynamic Batching affects only non-animated meshes (that is, MeshRenderer, but not SkinnedMeshRenderer), there is no reason to combine texture files for animated characters into an Atlas. Since they are animated, the GPU needs to multiply each object's bones by the transform of the current animation state. This means a unique calculation is needed for each character, and they will result in an extra Draw Call regardless of any attempts we make to have them share Materials
Adjust compression rates for non-square textures
Texture files are normally stored in a square, power-of-two format, meaning that their height and width are equal in length, and its size is a power of two. For example, typical sizes are 256 x 256 pixels, 512 x 512, 1024 x 1024, and so on.
Sparse Textures
Procedural Materials
Asynchronous Texture Uploading
Mesh and animation files
These file types are essentially large arrays of vertex and skinned bone data
Reduce polygon count
This is the most obvious way to gain performance and should always be considered. In fact, since we cannot batch objects using Skinned Mesh Renderers, it's one of the good ways of reducing CPU and GPU runtime overhead for animated objects.
Reducing the polygon count is simple, straightforward, and provides both CPU and memory cost savings for the time required for artists to clean up the mesh. Much of an object's detail is provided almost entirely by detailed texturing and complex shading in this day and age, so we can often get away with stripping away a lot of vertices on modern meshes and most users would be unable to tell the difference.
Tweak Mesh Compression
Unity offers four different Mesh Compression settings for imported mesh files: Off, Low, Medium, and High. Increasing this setting will convert floating-point data into fixed values, reducing the accuracy in vertex position/Normal direction, simplifying vertex color information, and so on
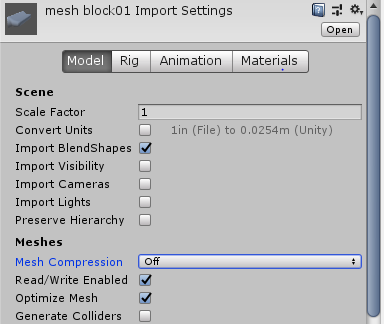
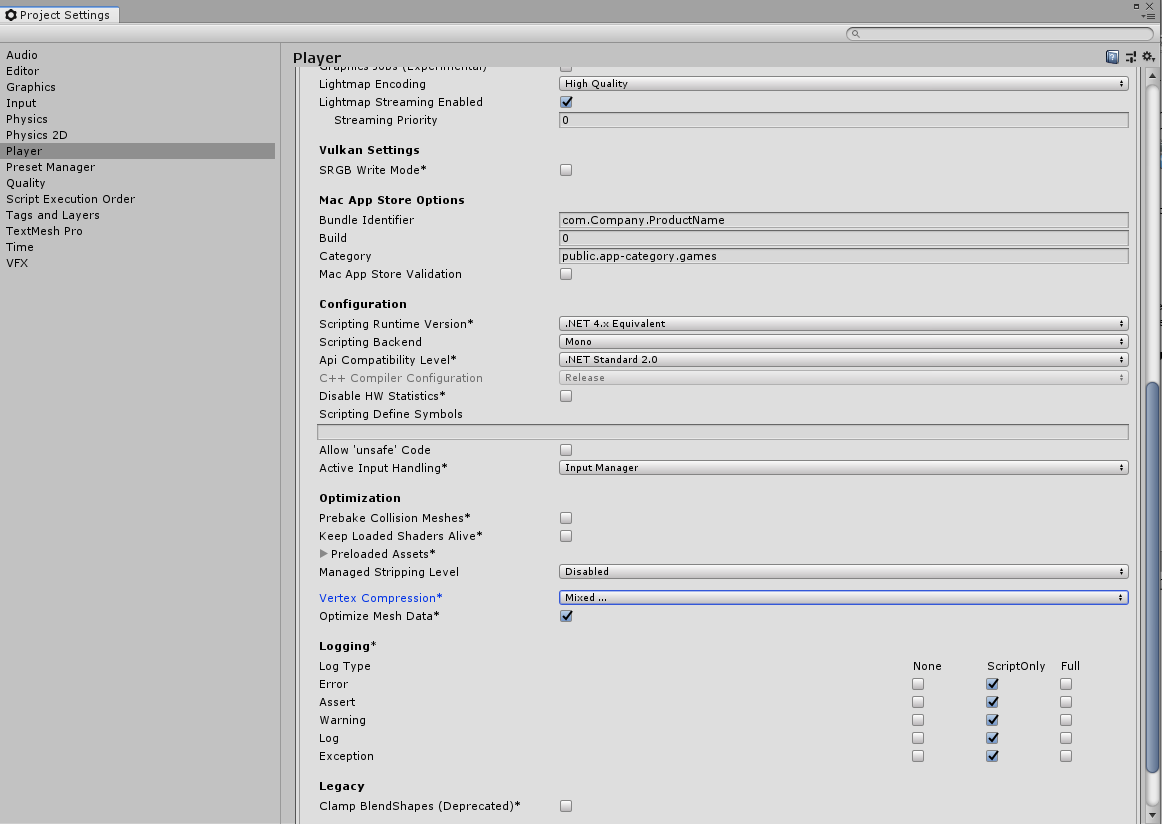
We can use the Vertex Compression option to configure the type of data that will be optimized when we import a mesh file with Mesh Compression enabled, so if we want accurate Normal data (for lighting), but have less worry over positional data, then we can configure it here. Unfortunately, this is a global setting and will affect all imported meshes (although it can be configured on a per-platform basis since it is a Player setting).
Enabling Optimize Mesh Data will strip away any data from the mesh that isn't required by the Material(s) assigned to it. So, if the mesh contains tangent information, but the Shader never requires it, then Unity will ignore it during build time
3D mesh building/animation tools often provide their own builtin ways of automated mesh optimization in the form of estimating the overall shape and stripping the mesh down tofewer total polygons. This can cause significant loss of quality and should be tested vigorously if used
Use Read-Write Enabled appropriately
The Read-Write Enabled flag allows changes to be made to the mesh at runtime either via Scripting or automatically by Unity during runtime, similar to how it is used for texture files. Internally, this means that it will keep the original mesh data in memory until we want to duplicate it and make changes dynamically. Disabling this option will allow Unity to discard the original mesh data from memory once it has determined the final mesh to use, since it knows it will never change.

If we use only a uniformly scaled version of a mesh throughout the entire game, then disabling this option will save runtime memory since we will no longer need the original mesh data to make further rescaled duplicates of the mesh (incidentally, this is how Unity organizes objects by scale factor when it comes to Dynamic Batching). Unity can, therefore, discard this unwanted data early since we will never need it again until the next time the application is launched.
However, if the mesh often reappears at runtime with different scales, then Unity needs to keep this data in memory so that it can recalculate a new mesh more quickly, hence it would be wise to enable the Read-Write Enabled flag. Disabling it will require Unity to not only reload the mesh data each time the mesh is reintroduced, but also make the rescaled duplicate at the same time, causing a potential performance hiccup.
Unity tries to detect the correct behavior for this setting at initialization time, but when meshes are instantiated and scaled in a dynamic fashion at runtime, we must force the issue by enabling this setting. This will improve instantiation speed of the objects, but cost some memory overhead since the original mesh data is kept around until it's needed
Note that this potential overhead cost also applies when using the Generate Colliders option
Consider baked animations
This tip will require changes in the asset through the 3D rigging and animation tool that we are using since Unity does not provide such tools itself. Animations are normally stored as key frame information where it keeps track of specific mesh positions and interpolates between them at runtime using skinning data (bone shapes, assignments, animation curves, and so on). Meanwhile, baking animations means effectively sampling and hardcoding each position of each vertex per-frame into the mesh/animation file without the need for interpolation and skinning data.
Using baked animations can, sometimes, result in much smaller file sizes and memory overhead than blended/skinned animations for some objects since skinning data can take up a surprisingly large amount of space to store. Thisis most likely to be the case for relatively simple objects, or objects with short animations, since we would effectively be replacing procedural data with a hardcoded series of vertex positions. So, if the mesh's polygon count is low enough where storing lots of vertex information is cheaper than skinning
data, then we may see some significant savings through this simple change.
In addition, how often the baked sample is taken can usually be customized by the exporting application. Different sample rates should be tested to find a good value where the key moments of the animation still shine-through what is essentially a simplified estimate.
Combine meshes
Forcefully combining meshes into a large, single mesh can be convenient to reduce Draw Calls, particularly if the meshes are too large for Dynamic Batching and don't play well with other statically batched groups. This is essentially the equivalent of Static Batching, but performed manually, so sometimes it's wasted effort if Static Batching could take care of the process for us.
Beware that if any single vertex of the mesh is visible in the Scene, then the entire object will be rendered together as one whole. This can lead to a lot of wasted processing if the mesh is only partially visible most of the time. This technique also comes with the drawback that it generates a whole new mesh asset file that we must deposit into our Scene, which means any changes we make to the original meshes will not be reflected in the combined one. This results in a lot of tedious workflow effort every time changes need to be made, so if Static Batching is an option, it should be used instead.
There are several tools available online, which can combine mesh files together for us in Unity. They are only an Asset Store or Google search away.
Asset Bundles and Resources
Resource System can be a great benefit during prototyping
However, professional Unity projects should instead favor the Asset Bundle System. There are a number of reasons for this. Firstly, the Resource System is not very scalable when it comes to builds. All Resources are merged together into a single massive Serialized File binary data blob with an index list of where various assets can be found within it. This can be hard to manage, and take a long time to build, as we add more data to the list.
Secondly, the Resource System's ability to acquire data from the Serialized File scales in an Nlog(N) fashion, which should make us very wary of increasing the value of N. Thirdly, the Resource System makes it unwieldy for our application to provide different asset data on a per-device basis, whereas Asset Bundles tend to make this matter trivial. Finally, Asset Bundles can be used to provide small, periodic custom content updates to the application, while the Resource System would require updates that completely replace the
entire application to achieve the same effect
https://blogs.unity3d.com/2017/04/12/asset-bundles-vs-resources-a-memory-showdown/
Summary
5. Faster Physics
In this chapter, we will cover the following areas:
Understanding how Unity's Physics Engine works:
- Timesteps and FixedUpdates
- Collider types
- Collisions
- Raycasting
- Rigidbody active states
Physics performance optimizations:
- How to structure Scenes for optimal physics behavior
- Using the most appropriate types of Collider
- Optimizing the Collision Matrix
- Improving physics consistency and avoiding error-prone behavior
- Ragdolls and other Joint-based objects
Physics Engine internals
Physics and time
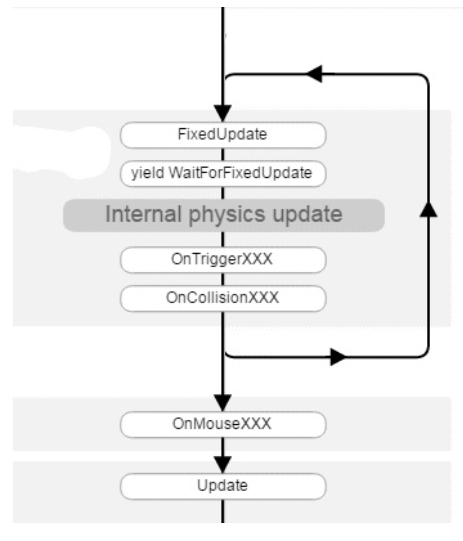
Maximum Allowed Timestep
It is important to note that if a lot of time has passed since the last Fixed Update (for example, the game froze momentarily), then Fixed Updates will continue to be calculated within the same Fixed Update loop until the Physics Engine has caught up with the current time.
For example, if the previous frame took 100 ms to render (for example, a sudden CPU spike caused the main thread to block for a long time), then the Physics Engine will need to be updated five times.
The FixedUpdate() method will, therefore, be called five times before Update() can be called again due to the default Fixed Update Timestep of 20 milliseconds.
Of course, if there is a lot of physics activity to process during these five Fixed Updates, such that it takes more than 20 milliseconds to resolve them all, then the Physics Engine will need to invoke a sixth update.
Consequently, it's possible during moments of heavy physics activity that the Physics Engine takes more time to process a Fixed Update than the amount of time it is simulating.
For example, if it took 30 ms to process a Fixed Update simulating 20 ms of Gameplay, then it has fallen behind, requiring it to process more Timesteps to try and keep up, but this could cause it to fall behind even further, requiring it to process even more Timesteps, and so on.
In these situations the Physics Engine is never able to escape the Fixed Update loop and allow another frame to render.
This problem is often known as the spiral of death.
However, to prevent the Physics Engine from locking up our game during these moments, there is a maximum amount of time that the Physics Engine is allowed to process each Fixed Update loop.
This threshold is called the Maximum Allowed Timestep, and if the current batch of Fixed Updates takes too long to process, then it will simply stop and forgo further processing until the next render update completes.
This design allows the Rendering Pipeline to at least render the current state and allow for user input and gameplay logic to make some decisions during rare moments where the Physics Engine has gone ballistic (pun intended).
This setting can be accessed through Edit | Project Settings | Time | Maximum Allowed Timestep
Physics updates and runtime changes
When the Physics Engine processes a given timestep, it must move any active Rigidbody objects(GameObjects with a Rigidbody Component), detect any new collisions, and invoke the collision callbacks on the corresponding objects.
The Unity documentation makes an explicit note that changes to Rigidbody objects should be handled within FixedUpdate() and other physics callbacks for exactly this reason.
These methods are tightly coupled with the update frequency of the Physics Engine as opposed to other parts of the Game Loop, such as Update().
This means that callbacks such as FixedUpdate() and OnTriggerEnter() are safe places to make Rigidbody changes, whereas methods such as Update() and Coroutines yielding on WaitForSeconds or WaitForEndOfFrame are not.
Ignoring this advice could cause unexpected physics behavior, as multiple changes may be made to the same object before the Physics Engine is given a chance to catch and process all of them.
It's particularly dangerous to apply forces or impulses to objects in Update() callbacks without taking into account the frequency of those calls.
For instance, applying a 10-Newton force each Update while the player holds down a key would result in completely different resultant velocity between two different devices than if we did the same thing in Fixed Update since we can't rely on the number of Update() calls being consistent.
However, doing so in a FixedUpdate() callback will be much more consistent.
Therefore, we must ensure that all physics-related behavior is handled in the appropriate callbacks or we will risk introducing some especially confusing gameplay bugs that are very hard to reproduce.
It logically follows that the more time we spend in any given Fixed Update iteration, the less time we have for the next gameplay and rendering pass.
Most of the time this results in minor, unnoticeable background processing tasks, since the Physics Engine barely has any work to do, andthe FixedUpdate() callbacks have a lot of time to complete their work.
However, in some games, the Physics Engine could be performing a lot of calculations during each and every Fixed Update.
This kind of bottlenecking in physics processing time will affect our frame rate, causing it to plummet as the Physics Engine is tasked with greater and greater workloads.
Essentially, the Rendering Pipeline will try to proceed as normal, but whenever it's time for a Fixed Update, in which the Physics Engine takes a long time to process, the Rendering Pipeline would have very little time to generate the current display before the frame is due, causing a sudden stutter.
This is in addition to the visual effect of the Physics Engine stopping early because it hit the Maximum Allowed Timestep.
All of this together would generate a very poor user experience.
Hence, in order to keep a smooth and consistent frame rate, we will need to free up as much time as we can for rendering by minimizing the amount of time the Physics Engine takes to process any given timestep.
This applies in both the best-case scenario (nothing moving) and worst-case scenario (everything smashing into everything else at once).
There are a number of time-related features and values we can tweak within the Physics Engine to avoid performance pitfalls such as these.
Static Colliders and Dynamic Colliders
Dynamic Colliders simply mean GameObjects that contain both a Collider Component (which could be one of several types) and a Rigidbody Component.
We can also have Colliders that do not have a Rigidbody Component attached, and these are called Static Colliders.
Collision detection
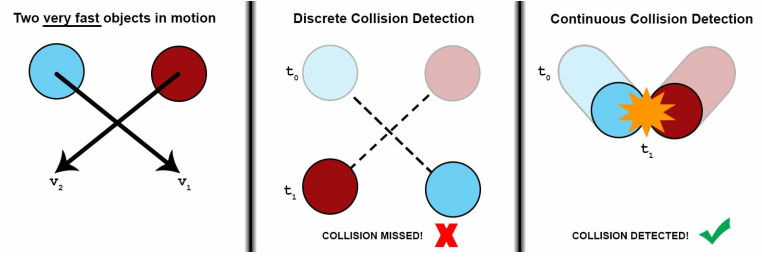
Collider types
The Collision Matrix
The Collision Matrix can be accessed through Edit | Project Settings | (Physics / Physics2D) | Layer Collision Matrix.
Rigidbody active and sleeping states
Every modern Physics Engine shares a common optimization technique, whereby objects that have come to rest have their internal state changed from an active state to a sleeping state.
The threshold value that controls the sleeping state can be modified under Edit | Project Settings | Physics | Sleep Threshold.
Ray and object casting
Another common feature of Physics Engines is the ability to cast a ray from one point to another and generate collision information with one or more of the objects in its path.
This is known as Raycasting.It is pretty common to implement several gameplay mechanics through Raycasting, such as firing a gun.
This is typically implemented by performing Raycasts from the player to the target location and finding any viable targets in its path (even if it's just a wall).
We can also obtain a list of targets within a finite distance of a fixed point in space using a Physics.OverlapSphere() check.
This is typically used to implement area-of-effect gameplay features, such as grenade or fireball explosions.
We can even cast entire objects forward in space using Physics.SphereCast() and Physics.CapsuleCast().
These methods are often used to simulate wide laser beams, or if we simply want to see what would be in the path of a moving character.
Debugging Physics
Physics performance optimizations
Scene setup
Scaling
Positioning
Mass
Use Static Colliders appropriately
Use Trigger Volumes responsibly
Optimize the Collision Matrix
Prefer Discrete collision detection
Modify the Fixed Update frequency
Adjust the Maximum Allowed Timestep
Minimize Raycasting and bounding-volume checks
Avoid complex Mesh Colliders
Use simpler primitives
Use simpler Mesh Colliders
Avoid complex physics Components
Let physics objects sleep
Modify the Solver Iteration Count
Optimize Ragdolls
Reduce Joints and Colliders
Avoid inter-Ragdoll collisions
Replace, deactivate or remove inactive Ragdolls
Know when to use physics
Summary
6. Dynamic Graphics
There is no question that the Rendering Pipeline of a modern graphics device is complicated. Even rendering a single triangle to the screen requires a multitude of Graphics API calls, covering tasks such as creating a buffer for the Camera view that hooks into the Operating System (usually via some kind of windowing system), allocating buffers for vertex data, setting up data channels to transfer vertex and texture data from RAM to VRAM, configuring each of these memroy spaces to use a specific set of data formats, determing the objects that are visible to the Camera, setting up and initiating a Draw Call for the triangle, waiting for the Rendering Pipeline to complete its task(s), and finally presenting the rendered image to the screen. However, there's a simple reason for this seemingly convoluted and over engineered way of drawing such a simple object--rendering often involves repeating the same tasks over and over again, and all of this inital setup makes future rendering tasks very fast.
CPUs are designed to handle virtually any computational scenario, but can't handle too many tasks simultaneously, whereas GPUs are designed for incredibly large amounts of parallesim, but they are limited in the complexity they can handle without breaking that parallelism. Their parallel nature requires immense amounts of data to be copied around very rapidly.During the setup of the Rendering Pipeline, we configure memory data channels for our graphics data to flow through. So , if these channels are properly configured for the types of data we will be passing, then they will operate more efficiently. However, setting them up poorly will result in the opposite.
Both the CPU and GPU are used during all graphics rendering, making it a high-speed dance of processing and memory management that spans software; hardware; multiple memory spaces, programming languages(each suited to different optimizations), processors, and processor types; and a large number of special-case features that can be thrown into the mix.
To make matters even more complicated, evey rendering situation we we will come across is different in its own way. Running the same application against two different GPUs often results in an apples-versus-oranges comparison due to the different capabilities and APIs they support. It can be difficult to determine where a bottleneck resides within such a complex web of hardware and software systems, and it can take a lifetime of industry work in 3D graphics if we want to have a strong, immediate intuition about the source of performance issues in mordern Rendering Pipeline.
Thankfully, Profiling comes to the resuce once again, which makes becoming a Rendering Pipeline wizard less of necessity. If we can gather data about each device, use multiple performance metrics for comparison, and tweak our Scenes to observe how different rendering features affect their behavior, then we should have sufficient evidence to find the root cause of an issue and make appropriate changes. So, in this chapter, you will learn how to gather the right data, dig just deep enough into the Rendering Pipeline to find the true source of the problem, and explore various solutions and workarounds for a multitude of potential problems.
There are many topics to be covered when it comes to improving rendering performance. So, in this chapter, we will explore the following topics:
A biref exploration of the Rendering Pipeline, focusing on the parts where the CPU and GPU come into play
General techniques on how to determine whether our rendering is limited by the CPU or by GPU
A series of performance optimization techniques and features, as follows:
- GPU Instancing
- Level Of Detail (LOD) and other Culling Groups
- Occlusion Culling
- Particle Systems
- Unity UI
- Shader optimization
- Lighting and Shadow optimization
- Mobile-specific rendering enhancements
The Rendering Pipeline
Poor rendering performance can manifest itself in a number of ways, depending on whether the devices is limited by CPU activity(we are CPU bound) or by GPU activity(we are GPU bound). Investigating a CPU-bound application can be relatively simple since all of the CPU works is wrapped up in loading data from disk/memory and calling Graphics API instructions. However, a GPU-bound application can be more difficult to analyze since the root cause could originate from one of a large number of potential places within the Rendering Pipeline. We might find that we need to rely on a little guesswork on process of elimination in order to determine the source of a GPU bottleneck. In either case, once the problem is discovered and resolved, we can expect significant improvements since small fixes tend to reap big rewards when it comes to fixing issues in the Rendering Pipeline.
CPU sends rendering instructions through the Graphics API that funnels through the hardware driver to the GPU device, which results in a list of rendering instructions being accumulated in a queue known as the Command Buffer. These commands are processed by the GPU one by one until the Command Buffer is empty. So long as the GPU can keep up with the rate and complexity of instructions before the next frame is due to begin, we will maintain our fame rate. However, if the GPU falls behind, or the CPU spends too much time generating commands, the frame rate will start to drop.
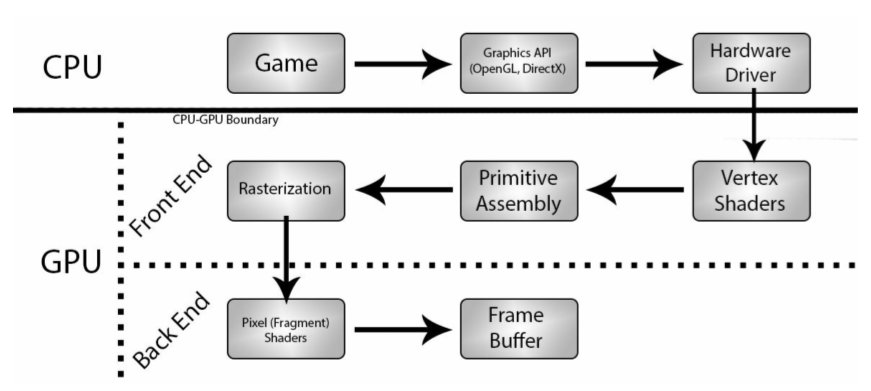
The GPU Front End
The Front End referes to the part of the rendering process where the GPU handles vertex data. It will receive mesh data from the CPU(a big bundle of vertex information), and a Draw Call will be issued. The GPU then gathers all pieces of vertex information from the mesh data and passes them through Vertex Shaders, which are given an opportunity to modify them and output them in to a 1-to-1 manner. From this, the GPU now has a list of Primitives to process(triangels--the most primitive shapes in 3D graphics). Next, the Rasterizer takes these Primitives and determines which pixels of the final image will need to be drawn on to create the Primitive based on positions of its vertices and the current Camera view. The list of pixels generated from this process is known as fragments, which will be processed in the Back End
Vertex Shaders are small C-like programs that determine the input data that they are interested in and the way that they will manipulate it, and then will output a set of information for the Rasterizer to generate fragments with. It is also home to the process of Tessellation, which is handled by Geometry Shaders(sometimes called Tesselation Shaders), similar to a Vertex Shader in that they are small scripts uploaded to the GPU, except that they are allowed to output vertices in a 1-to-many manner, thus generating additional geometry programmatically.
The GPU Back End
The Back End represents the part of the Rendering Pipeline where fragments are processed. Each fragment will pass through a Fragment Shader(also known as a Pixel Shader). These Shaders tend to invovle a lot more complex activity compared to Vertex Shaders, such as depth testing, alpha testing, colorization, texture sampling, Lighting, Shadows, and various Post-Processing effects to name a few of the possibilites. This data is then drawn onto the Frame Buffer, which holds the current image that will eventually be sent to the display device(our monitors) once rendering tasks for the current frame are complete.
There are normally two Frame Buffers in use by Graphics APIs by default(although more could be generated for custom rendering scenarios). At any given moment, one of the Frame Buffers contains the data from the frame we just rendered to, and is being presented to the screen, while the other is actively being drawn to by the GPU while it completes commands from the Command Buffer. Once the GPU reaches a swap buffers command (the final instruction the CPU asks it to complete for the given frame), the Frame Buffers are flipped around so that the new frame is presented. The GPU will then use the old Frame Buffer to draw the next frame. This process repeats each time a new frame is rendered, hence the GPU only needs two Frame Buffers to handle this task.
This entire process, from making Graphics API calls to swapping Frame Buffers, repeats continuously for every mesh, vertex, fragment, and frame, so long as our application is still rendering.
There are two metrics that tend to be the source of bottlenecks in the Back End--Fill Rate and Memory Bandwith.
Fill Rate
Fill Rate is a very broad term referring to the speed at which the GPU can draw fragments. However, this only includes fragments that have survived all of the various conditional tests we might have enabled within the given Fragment Shader. A fragment is merely a potential pixel, and if it fails any of the enabled tests, then it is immediately discarded. This can be an enormous performance-saver, as the Rendering Pipeline can skip the costly drawing step and begin working on the next fragment instead.
One such example of a test that might cull a fragment is Z-testing, which checks whether the fragment from a closer object has already been drawn to the same fragment location (the Z refers to the depth dimension from the point of view of the Camera). If so, the current fragment is discarded. If not, then the fragment is pushed through the Fragment Shader and drawn over the target pixel, which consumes exactly one fill from our Fill Rate. Now, imagine multiplying this process by thousands of overlapping objects, each of which generates hundreds or thousands of possible fragments(higher screen resolutions require more fragments to be processed). This could easily lead to millions of fragments to process each and every frame due to all of the possible overlap from the perspective of the Main Camera. On top of this, we're trying to repeat this process dozens of times every second. This is why performing so much initial setup in the Rendering Pipeline is important, and it should be fairly obvious that skipping as many of these draws as we can will reuslt in big rendering cost savings.
Graphics card manufacturers typically advertise a particular Fill Rate as a feature of the card, usually in the form of Gigapixels per-second, but this is a bit of misnomer, as it would be more accurate to call it Gigafragments per-second; however, this argument is mostly academic. Either way, larger values tell us that the device can potentially push more fragments through the Rendering Pipeline. So, with a budget of 30 Gigapixels per-second and a target frame rate of 60 Hz, we can afford to process 30,000,000,000/60 = 500 milion fragments per-frame before being bottlenecked on Fill Rate. With a resolution of 2560 x 1440, and a best-case scenario where each pixel is drawn over only once, we could theoretically draw the entire Scene about 125 times without any noticeable problems
Sadly, this is not a perfect world. Fill Rate is also consumed by other advanced rendering techniques, such as Shadows and Post-Processing effects that needs to take the same fragment data and perform their own passes on the Frame Buffer. Even so, we will always end up with some amount of redraw over the same pixels due to the order in which objects are rendered. This is known as Overdraw, and it is a useful metric to measure how efficiently we are making use of our Fill Rate.
Overdraw
How much Overdraw we have can be represented visually by rendering all objects with additive alpha blending and a flat coloration. Areas of high Overdarw will show up more brightly, as the same pixels is drawn over with additive blending multiple times. This is precisely how the Scene window's Overdraw Shading mode reveals how much Overdraw our Scene is undergoing

The more Overdarw we have, the more Fill Rate we are wasting by overwriting fragment data. There are serveral techniques we can apply to reduce Overdraw, which we will explore later
Note that there are actually serveral different queues used for rendering, which can be separated into two types: Opaque Queues and Transparent Queues. Objects rendered in one of the Opaque Queue can cull away fragments via Z-testing as explained previously. However, objects rendered in a Transparent Queue cannot do so since their transparent nature means we can't assume that they won't need to be drawn no matter how many other objects are in the way, which leads to a lot of Overdraw. All Unity UI objects always render in a Transparent Queue, making them a significant sources of Overdraw.
Memory Bandwidth
The other potential source of bottlenecks in the Back End comes from Memory Bandwith. Memory Bandwidth is consumed whenever a texture must be pulled from a section of the GPU's VRAM down into the lower memory levels. This typically happens when a texture is sampled, where a Fragment Shader attempts to pick the matching texture pixel (or texel) to draw for a given fragment at a given location. The GPU contains multiple cores that each have access to the same area of VRAM, but they also each contain a much smaller, local Texture Cache that stores the texture(s) the GPU has been most recently working with. This is similar in design with the multitude of CPU memory cache levels that allow meory transfer up and down the chain. This is a hardware design workaround for the fact that faster memory will, invariably, be more difficult and expensive to produce. So, rather than having a giant, expensive block of VRAM, we have a large, cheap block of VRAM, but use a smaller, very fast, lower-level Texture Cache to perform sampling with, which gives us the best of both worlds, that is, fast sampling with lower costs.
In the event that we are bottlenecked in Memory Bandwith, the GPU will keep fetching the necessary texture files, but the entire process will be throttled, as the Texture Cache keeps waiting for data to appear before it can process a given batch of fragments. The GPU won't be able to push data back to the Frame Buffer in time to be rendered onto the screen, blocking the whole process and culminating in a poor frame rate
Lighting and Shadowing
In modern games, a single object rarely finishes rendering completely in a single step, primarily due to Lighting and Shadowing. These tasks are often handled in multiple passes of a Fragment Shader, once for each of the serveral Light sources, and the final result is combined so that multiple Lights are given a chance to be applied. The result appears much more realistic, or at least, more visually appealing.
Serveral passes are required to gather Shadowing information. We will first set up our Scene to have Shadow Casters and Shadow Receivers, which will create or receive Shadows, respectively. Then, each time a Shadow Receiver is rendered, the GPU renders any Shadow Caster objects from the point of view of the Light source into a texture with the goal of collecting distance information for each of their fragments.It then doese the same for the Shadow Receiver, except now that is knows which fragments the Shadow Casters would overlap from the Light source, it can render those fragments darker since they will be in the Shadow created by the Light source bearing down on the Shadow Caster
This information then becomes an additional texture known as a Shadowmap and is blended with the surface for the Shadow Receiver when it is rendered from the point of view of the Main Camera. This will make its surface appear darker in certain spots where other objects stand between the Light source and the given object. A similar process is used to create Lightmaps, which are pregenerated Lighting information for the more static parts of our Scene.
Lighting and Shadowning tends to consume a lot of resources throughout all parts of the Rendering Pipeline. We need each vertex to provide a Normal direction (a vector pointing away from the surface) to determine how Lighting should reflect off that surface, and we might need additional vertex color attributes to apply some extra coloring. This gives the CPU and Front End more information to pass along. Since multiple passes of Fragment Shaders are required to complete the final rendering, the Back End is kept busy both in terms of Fill Rate(lots and lots of pixels to draw, redraw, and merge) and in terms of Memory Bandwidth (extra textures to pull in or out for Lightmaps and Shadowmaps). This is why real-time Shadows are exceptionally expensive compared to most other rendering features and will inflate Draw Call counts dramatically when enabled
However, Lighting and Shadowing are perhaps two of the most important parts of game art and design to get right, often making the extra performance requirements worth the cost.
https://docs.unity3d.com/Manual/LightingOverview.html
https://unity3d.com/learn/tutorials/topics/graphics/introduction-lighting-and-rendering
Forward Rendering
Each of these Point Lights will be processed on a pre-vertex basis and all remaining Lights will be condensed into an average color by means of a technique called Spherical Harmonics.
As we might imagine, using Forward Rendering can utterly explode our Draw Call count very quickly in Scenes with a lot of Point Lights present due to the number of Render States being configured and Shader passes required.
http://docs.unity3d.com/Manual/RenderTech-ForwardRendering.html
Deferred Rendering
Deferred Rendering, or Deferred Shading as it is sometimes known, is a technique that has been available on GPUs for about a decade or so, bu it has not resulted in a complete replacement of the Forward Rendering method due to the caveats involved and somewhat limited support on mobile devices.
Deferred Shading is named as such because actual Shading does not occur until much later in the process, that is, it is deferred until later. It works by creating a geometry buffer (called a G-Buffer), where our Scene is initially rendered without any Lighting applied. With this information, the Deferred Shading system can generate a Lighting profile within a single pass
From a performance perspective, the results are quite impressive as it can generate very good per-pixel Lighting with little Draw Call effort. One disadvantage is that effect such as anti-aliasing, transparency, and applying Shadows to animated characters cannot be managed through Deferred Shading alone. In thi case, the Forward Rendering technique is applied as a fallback to cover those tasks, thus requiring extra Draw Calls to complete it. A bigger issue with Deferred Shading is that it often requires more powerful and more expensive hardware and is not available for all platforms, so fewer users will be able to make use of it
Vertex Lit Shading (legacy)
Global Illumination
Global Illumination, or GI for short, is an implementation of baked Lightmapping. LightMapping is similar to the Shadowmaps created by Shadowing techniques in that one or more textures are generated for each object that represents extra Lighting information and is later applied to the object during its Lighting pass of a Fragment Shader to simulate static Lighting effects.
The main difference between these Lightmaps and other forms of Lighting is that Lightmaps are pregenerated (or baked) in the Editor and packaged into the game build. This ensures that we don't need to keep regenerating this information at runtime, saving numerous Draw Calls and significant GPU activity. Since we can bake this data, we have the luxury of time to generate very high-quality Lightmaps (at the expense of larger generated texture files we need to work with, of course)
Since this information is baked ahead of time, it cannot resond to real-time activity during gameplay, and so by default, any Lightmapping information will only be applied to static objects that were present in the Scenen when the Lightmap was generated and at the exact location they were placed. However, Light Probes can be added to the Scene to generate an additional set of Lightmap textures that can be applied to nearby dynamic objects that move, allowing uch objects to benefit from pregenerated Lighting. This won't have pixel-perfect accuracy and will cost disk space for the extra Light Probe maps and Memory Bandwith at runtime to swap them around, but it does generate a more believeable and pleasant Lighting profile.
There have been seral techniques of generating Lightmaps developed throughout the years, and Unity has used a couple of different solutions since its inital release. Global Illumination is simply the latest generation of the mathematical techniques behind Lightmapping, which offers very realistic coloring by calculating not only how Lighting affects a given object, but also how light reflects off nearby surfaces, allowing an object to affect the Lighting profile of those around it. This effect is calculated by an internal system called Enlighten.This tool is used both to create static Lightmaps, as we as create something called Pre-computed Real-time GI, which is a hybird of real-time and static Shading and allows us to simulate effects such as time-of-day (where the direction of light from the Sun changes over time) without relying on expensive real-time Lighting effects.
Multithreaded Rendering
Multithreaded Rendering is enabled by default on most systems, such as desktop and console platforms whose CPUs provide multipl cores. Other platforms still support many low-end devices to enable this feature by default, so it is a toggleable option for them. For Android, it can be enabled via a checkbox under Edit->Project Settings->Player->Other Settings->Multithreaded Rendering, whereas for iOS, Multithreaded Rendering can be enabled by configuring the application to make use of Apple's Metal API under Edit->Project Settings->Player->Other Settings->Graphics API. At the time of writing this book, WebGL does not support Multithreaded Rendering.
For each object in our Scene, there are three tasks to complete: determine whether the object needs to be rendered (through a technique known as Frustum Culling), and if so, generate commands to render the object (since rendering a single object can result in dozens of different commands), and then send the command to the GPU using the relevant Graphics API. With out Multithreaded Rendering, all of these tasks must happend on the main thread of the CPU, thus any activity on the main thread becomes part of the critical path for all rendering. When Multithreaded Rendering is enabled, the task of pushing commands into the GPU are handled by a render thread, whereas other tasks such as culling and generating commands get spread across multiple worker threads. This setup can save an enormous number of CPU cycles for the main thread, which is where the overwhelming majority of other CPU tasks take place, such as physics and script code.
Enabling this feature will affect what is means to be CPU bound. Without Multithreaded Rendering, the main thread is performing all of the work necessary to generate instructions for the Command Buffer, meaning that any performance we can save elsewhere will free up more time for the CPU to generate commands. However, when Multithreaded Rendering is taking place, a good portion of the workload is pushed onto separate threads, meaning that improvements to the main thread will have less of an impact on rendering performance via the CPU
Low-level rendering APIs
Unity exposes a rendering API to us through their CommandBuffer class. This allows us to control the Rendering Pipeline directly through our C# code by issuing high-level rendering commands, such as render this object, with this Material, using this Shader, or draw N isntances of this piece of procedural geometry. This customization is not as powerful as having direct Graphics API access, but it is a step in the right direction for Unity developers to customize unique graphical effects.
http://docs.unity3d.com/ScriptReference/Rendering.CommandBuffer.html
If an even more direct level of rendering control is needed, such taht we wish to make direct Graphics API calls to OpenGL, DirectX, and Metal, then be aware that it is possible to create a Native Plugin(a small library written in C++ code that is compiled specifically for the architecture of the target platform) that hooks into the Unity's Rendering Pipeline, setting up callbacks for when particular rendering events happen, similar to how MonoBehaviours hook into various allbacks of the main Unity Engine. This is certainly an advanced topic for most Unity users, but useful to know for the future as our knowledge of rendering techniques and Graphics APIs matures.
https://docs.unity3d.com/Manual/NativePluginInterface.html
Detecting performance issues
Profiling rendering issues
The following screenshot shows Profiler data for a CPU-bound application. The test involved creating thousands of simple cube objects, with no batching or Shadowing techniques taking place. This resulted in an extremely large Draw Call count (around 32,000) for the CPU to generate commands for, but giving the GPU relatively little work to do due to the simplicity of the objects being rendered:
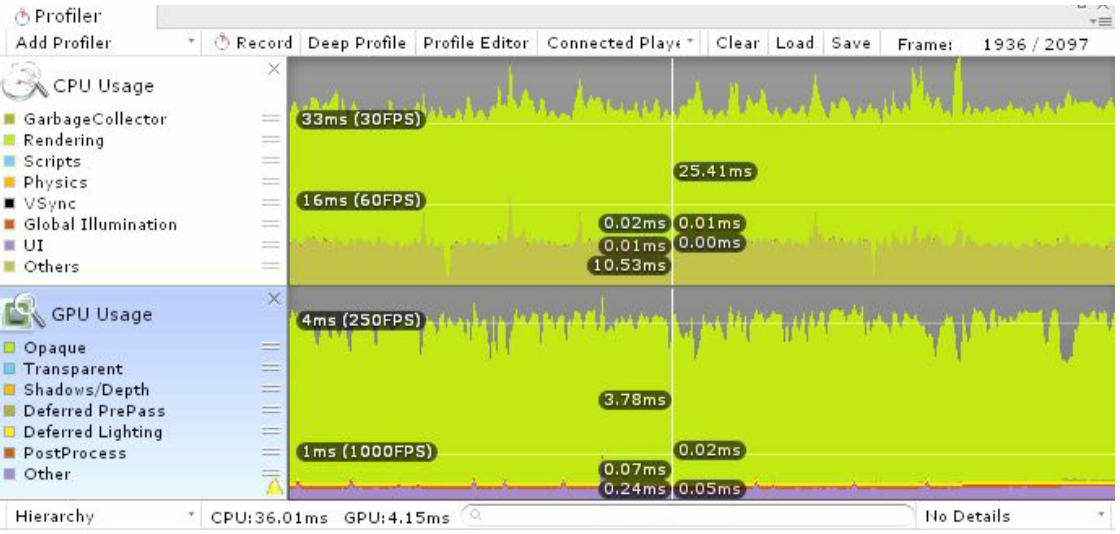
This example shows that the CPU's Rendering task is consuming a large amount of cycles (around 25 ms per-frame), whereas the GPU is processing for less than 4 milliseconds, indicating that the bottleneck resides in the CPU.
Meanwhile, Profiling a GPU-bound application via the Profiler is a little trickier. This time, the test involves creating a simple object requiring minimal Draw Calls, but using a very expensive Shader that samples a texture thousands of times to create an absurd amount of activity in the Back End
To perform fair GPU-bound Profiling tests, you should ensure that you disable Vertical Sync through Edit->Project Settings->Quality->Other->V Sync Count, otherwise it is likely to pollute our data

As we can see in the preceding screenshot, the rendering task of the CPU Usage Area matches closely with the total redering costs of the GPU Usage Area. We can also see that the CPU and GPU time costs at the bottom of the image are relatively similar (about 29 milliseconds each). This is somewhat confusing as we seem to be bottlenecked equally in both devices, where we would expect the GPU to be working much harder than the CPU
In actuality, if we drill down into the Breakdown View of the CPU Usage Area using the Hierarchy Mode, we will note that most of the CPU time is spent on the task labeled Gfx.WaitForPresent. This is the amount of time that the CPU is wasting while it waits for the GPU to finish the current frame. Hence, we are in fact bottlenecked by the GPU despite appearing as though we are bound by both. Even if Multithreaded Rendering is enabled, the CPU must still wait for the Rendering Pipeline to finish before it can begin the next frame.
Gfx.WaitForPresent is also used to signal that the CPU is waiting on Vertical Sync to complete, hence the need to disable it for this test.
Brute-force testing
Rendering performance enhancements
Enable/Disable GPU Skinning
The first tip involves a setting that eases the burden on the CPU or GPU Front End at the expnse of the other, that is, GPU Skinning. Skinning is the process where mesh vertices are transformed based on the current location of their animated bones. The animation system, working on the CPU, transforms the object's bones that are used to determine its current pose, ut the next important step in the animation process is wrapping the mesh vertices around those bones to place the mesh in the final pose. This is achived by iterating over each vertex and performing a weighted average against the bones connected to those vertices
This vertex processing task can either take place on the CPU on within the Front End of the GPU, depending on whether the GPU Skinning option is enabled. This feature can be toggled under Edit->Project Settings->Player Settings->Other Settings->GPU Skinning. Enabling this option pushes skinning activity to the GPU, although bear in mind that the CPU must still transfer the data to the GPU and will generate instructions on the Command Buffer for the task, so it doesn'/t remove the CPU's workload entirely. Disabling this option eases the burden on the GPU by making the CPU resolve the mesh's pose before transferring mesh data across and smiply asking the GPU to draw it as is. Obviously, this feature is useful if ew have lots of animated meshes in our Scenes and can be used to help either bounding case by pushing the work onto the device that is least busy.
Reduce geometric complexity
It is not uncommon to use a mesh that contains a lot of unnecessary UV and Normal vector data, so our meshes should be double-checked for this kind of superfluous fluff. We should also let Unity optimize the structure for us, which minimizes cache misses as vertex data is read within the Front End.
The goal is to simply reduce actual vertex counts. There are three solutions to this. First, we can simplify the mesh by either having the art team manually tweak and generate meshes with lower polycounts or using a mesh decimation tool to do it for us. Second, we could simply remove meshes from the Scene, but this should be a last resort. The third option is to implement automatic culling through features such as Level of Detail (LOD)
Reduce Tessellation
Tessellation through Geometry Shaders can be a lot of fun, as it is a relatively underused technique that can really make our graphical effects stand out from among the crowd of games that use only the most common effects. However, it can contribute enormously to the amount of processing work taking place in the Front End.
There aren't really any simple tricks we can exploit to improve Tessellation, besides improving our Tessellation algorithms or easing the burdern cased by other Front End tasks to give our Tessellation tasks more room to breathe.Either way, if ew have a bottleneck in the Front End and are making use of Tessellation techniques, we shoul double-check that they are not consuming the lion's share of the Front End's budget
Employ GPU Instancing
GPU Instancing is a means to render multiple copies of the same mesh quickly by exploiting the fact that they will have identical Render States, hence require minimal Draw Calls. This is practically identical to Dynamic Batching, except that it is not an automatic process. In fact, we can think of Dynamic Batching as poor-man's GPU Instancing since GPU Instancing can enable even better savings and allows for more customization by allowing parameterized variations.
GPU Instancing is applied at the Material level with the Enable Instancing checkbox, and variations can be introduced by modifying Shader code. This way, we can give different instances different rotations, scales, colors, and so on. This is useful for rendering Scenes such as forests and rocky areas where we want to render hundreds or thousands of different copies of a mesh with some slight variation.
Note that Skinned Mesh Renderers cannot be instanced for similar reasons that they cannot be Dynamically Batched, and ot all platforms and APIs support GPU Instancing
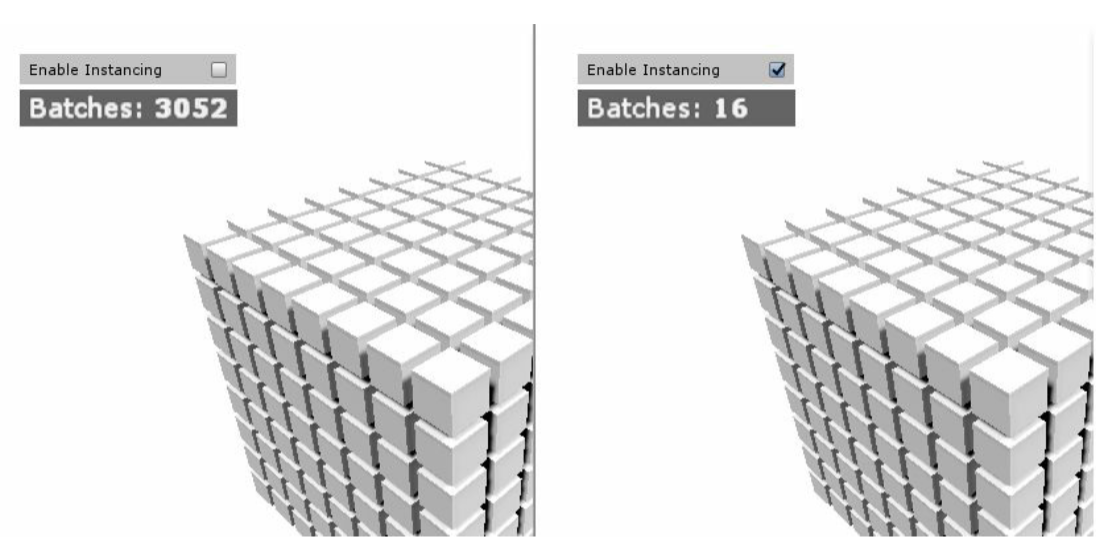
https://docs.unity3d.com/Manual/GPUInstancing.html
Use mesh-based Level Of Detail (LOD)
LOD is a broad term referring to the dynamic replacement of features based on their distance from the Camera and/or how much space they take up in the Camera's view. Since it can be difficult to tell the difference between a low and a high-quality object at great distances, there is very little reason to render the high-quality version, and so we may as well dynamically replace distant objects with something more simplified. The most common implementation of LOD is mehs-based LOD, where meshes are dynamically replaced with lower detailed versions as the Camera gets farther and farther away.
Making sure of mesh-based LOD can be achieved by placing multiple objects in the Scene and making them children of a GameObject with an attached LODGroup Component The LOD Group's purpose is to generate a bounding-box from these objects and decide which object should be rendered based on the size of the bounding-box within the Camera's field of view. If the object's bounding-box consumes a large area of the current view, then it will enable the mesh(es) assigned to lower LOD Groups, and if the bounding-box is very small, it will replace the mesh(es) with those from higher LOD Groups.If the mesh is too far away, it can be configured to hide all child objects. So, with the proper setup, we can have Unity replace meshes with simpler alternatives, or cull them entirely which eases the burdern on the rendering process.
https://docs.unity3d.com/Manual/LevelOfDetail.html
This feature can cost us a large amount of development time to fully implement; artists must generate lower polygon count versions of the same object, and level designers must generate LOD Groups, configure them, and test them to ensure that they don't cause jarring transitions as the Camera moves coloser or farther away.
Mesh-based LOD will also cost us in disk footprint as well as RAM and CPU; the alternative meshes need to be bundled, loaded into RAM, and the LODGroup Component must routinely test whether the Camera has moved to a new position that warrants a change in LOD level. The benefits on the Rendering Pipeline are rather impressive, however. Dynamically rendering simpler meshes reduces the amount of vertex data we need to pass and potentially reduces the number of Draw Calls, Fill Rate, and Memory Bandwith needed to render the object.
Due to the number of sacrifices needed for mesh-based LOD to function, developers should avoid preoptimizing by automatically assuming that mesh-based LDO will help them. Excessive use of the feature will lead to burdening other parts of our application's performance and chew up recious development time, all for the sake of paranoia. It should only be used if we start to observe problems in the Rendering Pipelien, and we've got CPU, RAM, and development time to spare
Having said that, Scenes that feature large, expansive views of the world and have lots of Camera movement, might want to consider implementing this technique very early, as the added distance and massive number of visible objects will likely exacerbate the vertex count enormously. As a counter example, Scenes that are always indoors or feature a Camera with a viewpoint looking down at the world will find little benefit in this technique since objects will tend to be at a similar distance from the Camera at all times Examples included Real-Time Strategy(RTS) and Multiplayer Online Battle Arena (MOBA) games.
Culling Groups
Culling Groups are a part of the Unity API that effectively allows us to create our own custom LOD system as a means of coming up with our own ways of dynamically replacing certain gameplay or rendering behaviors. Some examples of things we might want to apply LOD to include replacing animated characters with a version with fewer bones, applying simpler Shaders, skipping Particle System generation at great distances, simplifying AI behavior, and so on
Since the Culling Group system at its basic level simply tell us whether objects are visible to the Camera, and how big they are, it also has other uses in the realm of Gameplay, such as determining whether certain enemy spawn points are currently visible to the player or whether a player is approaching certain areas. There are a wide range of possibilites available with the Culling Group system that makes it worth considering. Of course, the time spent to implement, test, and redesign Scenes to exploit can be significant
https://docs.unity3d.com/Manual/CullingGroupAPI.html
Make use of Occlusion Culling
Optimizing Particle Systems
Particle Systems are useful for a huge number of different visual effects, and usually the more particles they generate, the better the effect looks. However, we will need to be responsible about the number of particles generated and the complexity of Shaders used since they can touch on all parts of the Rendering Pipeline; they generate a lot of vertices for the Front End(each particle is a quad) and could use multiple textures, which consume Fill Rate and Memory Bandwith in the BackEnd, so they can potentially cause an application to be found anywhere if used irresponsibly.
Reducing Particle System density and complexity are fairly straightforward--use fewer Particle Systems, generate fewer particles, and/or use fewer special effects. Altasing is also another common technique to reduce Particle System performance costs. However, there is an important performance consideration behind Particle Systems that is not too well known and happens behind the Scenes, and that is the process of automatic Particle System culling.
Make use of Particle System Culling
https://blogs.unity3d.com/2016/12/20/unitytips-particlesystem-performance-culling/
The basic idea is that all Particle Systems are either predictable or not (deterministic versus nondeterministic), depending on various settings. When a Particle System is predictable and not visible to the main view, then the entire Particle System can be automatically culled away to save performance. As soon as a predictable Particle System comes back into view, Unity can figure out exactly how the Particle System is meant to look at that moment as if it had been generating particles the entire time it wasn't visible. So long as the Particle System generates particles in a very procedural way, then the state is immediately solvable mathematically.
However, if any setting forces the Particle System to become unpredictable or nonprocedural, then it would have no idea what the current state of the Particle System needs to be, had it been hidden previously, and will hence need to render it fully every frame regardless of whether or not it is visible. Settings that break a Particle System's predictablility include, but are not limited to making the Particle System render in world-space, applying external forces, collisions, and Trails, or using complex Animation Curves. Check out the blog post mentioned previously for a rigorous list of nonprocedural conditions.
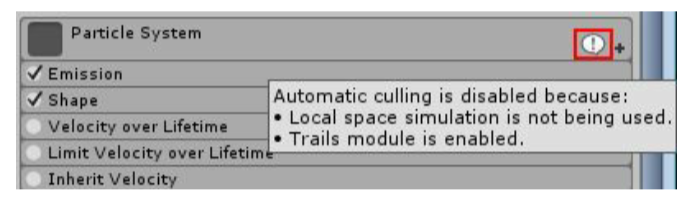
Avoid recursive Particle System calls
Many methods available to a ParticleSystem Component are recursive calls. Calling them will iterate through each child of the Particle System, which then calls GetComponent<ParticleSystem>() on each child, and if the Component exists, it will call the appropriate method. This then repeats for each child ParticleSystem beneath the original parent, its grandchildren, and so on. This can be a huge problem with deep hierachies of Particle Systems, which is sometimes the case with complex effects.
There are several ParticleSystem API calls affected by this behavior, such as Start(), Stop(), Pause(), Clear(), Simulate(), and isAlive(). We obviously cannot avoid these methods entirely since they represent the most common methods we would want to call on a Particle System. However, each of these methods has a withChildren parameter that defaults to true. By passing false in place of this parameter (for example, by calling Clear(false), it disables the recursive behavior and will not call into its children. Hence, the method call will only affect the given Particle System, thus reducing the overhead cost of the call.
This is not always ideal since we do often want all children of the Particle System to be affected by the method call. Another approach is to, therefore, cache the ParticleSystem Components in the same way we learned in Chapter 2, Scripting Strategies, and iterate through them manually ourselves (making sure that we pass false for the withChildren parameter each time)
Optimizing Unity UI
Use more Canvases
A Canvas Component's primary task is to manage the meshes that are used to draw the UI elements beneath them in the Hierarchy window and issues the Draw Calls necessary to render those elements. An important task of the Canvas is to batch these meshes together (which can only happen if they share the same Material) to reduce Draw Calls. However, when changes are made to a Canvas, or any of its children, this is known as dirtying the Canvas. When a Canvas is dirty, it needs to regenerate meshes for all of the UI elements beneath it before it can issue a Draw Call.This regeneration process is not a simple task and is a common source of performance problems in Unity projects, because unfortunately there are many things that can cause the Canvas to be made dirty.Even changing a single UI element within a Canvas can cause this to occur. There are so many things that cause dirtying, and so few that don't (and usually only in certain circumstances) that it's best to simply err on the side of caution and assume that any change will cause this effect.
Perhaps the only notable action that doesn't cause dirtying is changing a color property of a UI element.
If we find our UI causes a large spike in CPU usage any time something changes (or sometimes literally evey frame if they're being changed every frame), one solution we can apply is to simply use more Canvases. A common mistake is to build the entire game's UI in a single Canvas and keep it this way as the game code and its UI continues to become more complex.
This means that it will need to check every element every time anything changes in the UI, which can become more and more disastrous on performance as more elements are crammed into a single Canvas.However, each Canvas is independent and does not need to interact with other Canvases in the UI and so by splitting up the UI into multiple Canvases we can separate the workload and simplify the tasks required by any single Canvas.
In this case, even though an element still changes, fewer other elements will need to be regenerated in response, reducing the performance cost. The downside of this approach is that elements across different Canvases will not be batched together, so we should try to keep similar elements with the same Material grouped together within the same Canvas, if possible.
It's also possbile to make a Canvas a child of another Canvas, for the sake of organization, and the same rules apply. If an element changes in one Canvas, the other will be unaffected.
Separate objects between static and dynamic canvases
We should strive to try and generate our Canvases in a way that groups elements based on when they get updated. We should think of our elements as fitting within one of three groups: Static, Incidental Dynamic, and Continuous Dynamic. Static UI elements are those that never change, and good examples of these are background images, labels, and so on. Dynamic elements are those that can change, where Incidental Dynamic objects are those UI elements that only change in response to something, such as a UI button press or a hover action, whereas Continuous Dynamic objects are those UI elements that update regularly, such as animated elements.
We should try to split UI elements from these three groups into three different Canvases for any given section of our UI, as this will minimize the amount of wasted effort during regeneration.
Disable Raycast Target for noninteractive elements
UI elements have a Raycast Target option, which enables them to be interacted with by clicks, taps, and other user behavior. Each time one of these events take place, the GraphicsRaycaster Component will perform pixel-to-bounding-box checks to figure out which element has been interacted with and is a simple iterative for loop. By disabling this option for noninteractive elements, we're reducing the number of elements that the GraphicsRaycaster needs to iterate through, saving performance
Hide UI elements by disabling the parent Canvas Component
The UI uses a separate Layout System to handle regeneration of certain element types, which operates in a similar way as dirtying a Canvas. UIImage, UIText, and LayoutGroup are all examples of Components that fall under this system. There are many things that can cause a Layout System to become dirty, most obvious of which are enabling and disabling such elements. However, if we want to disable a portion of the UI, we can avoid these expensive regeneration calls from the Layout System by simply disabling the Canvas Component they are children of . This can be done by setting the Canvas Component's enabled property to false. The drawnback of this approach is that if any child objects that have some Update(), FixedUpdate(), LateUpdate(), or Coroutine code, then we would need to also disable them manually, otherwise they will continue to run. By disabling the Canvas Component, we're only stopping the UI from being rendered and interacted with, and we should expect various update calls to continue to happens as normal.
Avoid Animator Components
Unity's Animator Components were never intended to be used with the latest version of its UI System, and their interaction with it is a naive implementation. Each frame, the Animator will change properties on UI elements that causes their Layouts to be dirtied and cause regeneration of a lot of internal UI information. We should avoid using Animators entirely, and instead perform tweening ourselves or use a utility asset intended for such operations.
Explicitly define the Event Camera for World Space Canvases
Don't use alpha to hide UI elements
Optimizing ScrollRects
Make sure to use a RectMask2D
Disable Pixel Perfect for ScrollRects
Manually stop ScrollRect motion
Use empty UIText elements for full-screen interaction
Check the Unity UI source code
Check the documentation
Shader optimization
Consider using Shaders intended for mobile platforms
Use small data types
Avoid changing precision while swizzling
Use GPU-optimized helper functions
Disable unnecessary features
Remove unnecessary input dataExpose only necessary variables
Reduce mathematical complexity
Reduce texture sampling
Avoid conditional statements
Reduce data dependencies
Surface Shaders
Use Shader-based LOD
Use less texture data
Test different GPU Texture Compression formats
Minimize texture swapping
VRAM limits
Preload textures with hidden GameObjects
Avoid texture thrashing
Lighting optimization
Use real-time Shadows responsibly
Use Culling Masks
Use baked Lightmaps
Optimizing rendering performance for mobile devices
Avoid Alpha Testing
Minimize Draw Calls
Minimize Material count
Minimize texture size
Make textures square and power-of-two
Use the lowest possible precision formats in Shaders
Summary
7. Virtual Velocity and Augmented Acceleration
XR Development
Emulation
User comfort
Performance enhancements
The kitchen sink
Single-Pass versus Multi-Pass Stereo Rendering
Apply anti-aliasing
Prefer Forward Rendering
Image effects in VR
Backface culling
Spatialized audio
Avoid camera physics collisions
Avoid Euler anglesExercise restraint
Keep up to date with the latest developments
Summary
8. Masterful Memory Management
Fortunately, it is not necessary to become absolute masters of the C# language to use it effectively. This chapter will boil these complex subjectsdown to a more digestible form and is split into the following subjects:
- The Mono platform:
- Native and Managed Memory Domains
- Garbage collection
- Memory Fragmentation
- IL2CPP
- How to profile memory issues
- Various memory-related performance enhancements:
- Minimizing garbage collection
- Using Value types and Reference types properly
- Using strings responsibly
- A multitude of potential enhancements related to the Unity Engine
- Object and Prefab Pooling
The Mono platform
Unity Technologies built a Native C++ backend for the sake of speed and allows its users control of this Game Engine through Mono as ascripting interface.
Native Code is common vernacular for code that is written specifically for the given platform. For instance, writing code to create a window object or interface with networking subsystems in Windows would be completely different to code performing the tasks for a Mac, Unix, Playstation 4, XBox One, and so on
Managed Languages, which feature Managed Code. Technically, this was a term coined by Microsoft to refer to any source code that must run inside their Common Language Runtime(CLR) environment, as opposed to code that is compiled and run Natively through the target OS.
The term Managed tends to be used to refer to any language or code that depends on its own runtime environment and that may, or may not, include automatic garbage collection
For game development, use Managed Languages becomes a balancing act since not all resource usage will necessarily result in a bottleneck, and the best games aren't necessarily the ones that use every single byte to their fullest potential
Memory Domains
Memory space within the Unity Engine can be essentially split into three different Memory Domains. Each Domain stores different types of data and takes care of a very different set of tasks
Managed Domain
This Domain is where the Mono platform does its work, where any MonoBehaviour scripts and custom C# classes we write will be instantiated at runtime, and so we will interact with this Domain very explicitly through any C# code we write. It is called the Managed Domain because this memory space is automatically managed by a Garbage Collector.
The Managed Domain also includes wrappers for the very same object representations that are stored within the Native Domain. As a result, when we interact with Components such as Transform, most instructions will ask Unity to dive into its Native Code, generate the result there, and then copy it back to the Managed Domain for us. This is where the NativeManaged Bridge between the Managed Domain and Native Domains derives from, which was briefly mentioned in previous chapters. When both Domains have their own representations for the same entity, crossing the bridge between them requires a memory context-switch that can potentially inflict some fairly significant performance hits on our game. Obviously, crossing back and forth across this bridge should be minimized as much as possible due to the overhead involved.
Native Domain
The Native Domain--is more subtle since we only interact with it indirectly. Unity has an underlying Native Code foundation, which is written in C++ and compiled into our application differently, depending on which platform is being targeted. This Domain takes care of allocating internal memory space for things such as asset data (for example, textures, audio files, and meshes) and memory space for various subsystems such as the Rendering Pipeline, Physics System, and User Input System. Finally, it includes partial Native representations of important Gameplay objects such as GameObjects and Components so that they can interact with these internal systems. This is where a lot of built-in Unity classes keep their data, such as the Transform and Rigidbody Components
external libraries
The third and final Memory Domains are those of external libraries, such as DirectX and OpenGL libraries, as well as any custom libraries and plugins we include in our project. Referencing these libraries from our C# code will cause a similar memory context switch and subsequent cost
Memory in most modern Operating Systems (OS) splits runtime memory space into two categories: the stack and the heap.
During initialization of our Unity app, the Mono platform will request a given chunk of memory from the OS and use it to generate a heap memory space that our C# code can use (often known as the Managed Heap)
Garbage collection
The GC in the version of Mono that Unity uses is a type of Tracing Garbage Collector, which uses a Mark-and-Sweep strategy. This algorithm works in two phases: each allocated object is tracked with an additional bit. This flags whether the object has been marked or not. These flags start off set to false to indicate that it has not yet been marked.
The second phase involves iterating through this catalog of references (which the GC will have kept track of throughout the lifetime of the application) and determining whether or not it should be deallocated based on itsmarked status
In essence, the GC maintains a list of all objects in memory,while our application maintains a separate list containing only a portion of them. Whenever our application is done with an object, it simply forgets it exists, removing it from its list. Hence, the list of objects that can be safely deallocated would be the difference between the GC's list, and our application's list.
Memory Fragmentation
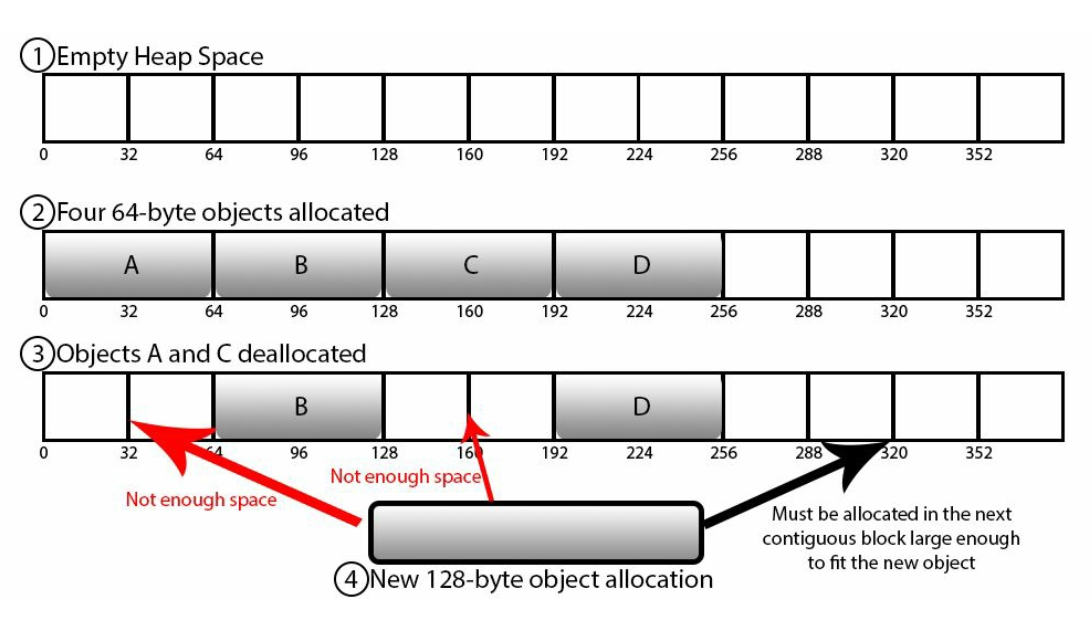
Memory Fragmentation causes two problems. Firstly, it effectively reduces the total usable memory space for new objects over long periods of time, depending on the frequency of allocations and deallocations. This is likely to result in the GC having to expand the heap to make room for new allocations. Secondly, it makes new allocations take longer to resolve due to the extra time it takes to find a new memory space large enough to fit the object.
Garbage collection at runtime
So, in a worst-case scenario, when a new memory allocation is being requested by our game, the CPU would have to spend cycles completing the following tasks before the allocation is finally completed:
1. Verify that there is enough contiguous space for the new object.
2. If there is not enough space, iterate through all known direct and indirect references, marking everything they connect to as reachable.
3. Iterate through all of these references again, flagging unmarked objects for deallocation.
4. Iterate through all flagged objects to check whether deallocating some of them would create enough contiguous space for the new object.
5. If not, request a new memory block from the OS in order to expand the heap.
6. Allocate the new object at the front of the newly allocated block and return it to the caller.
This can be a lot of work for the CPU to handle, particularly if this new memory allocation is an important object such as a Particle Effect, a new character entering the Scene, or a cutscene transition,. Users are extremely likely to note moments where the GC is freezing gameplay to handle this extreme case. To make matters worse, the garbage collection workload scales poorly as the allocated heap space grows since sweeping through a few Megabytes of space will be significantly faster than scanning several Gigabytes of space.
Threaded garbage collection
The GC runs on two separate threads: the main thread and what is called the Finalizer Thread. When the GC is invoked, it will run on the main thread and flag heap memory blocks for future deallocation. This does not happen immediately. The Finalizer Thread, controlled by Mono, can have a delay of several seconds before the memory is finally freed and available for reallocation.
We can observe this behavior in the Total Allocated block of the Memory Area within the Profiler window. It can take several seconds for the total allocated value to drop after a garbage collection has occurred. Owing to this delay, we should not rely on memory being available the moment it has been deallocated, and as such, we should never waste time trying to eke out every last byte of memory that we believe should be available. We must ensure that there is always some kind of buffer zone available for future allocations.
Blocks that have been freed by the GC may sometimes be given back to the OS after some time, which would reduce the reserved space consumed by the heap and allow the memory to be allocated for something else, such as another application. However, this is very unpredictable and depends on the platform being targeted, so we shouldn't rely on it. The only safe assumption to make is that as soon as the memory has been allocated to Mono, it's then reserved and is no longer available to either the Native Domain or any other
application running on the same system.
Code compilation
When we make changes to our C# code, it is automatically compiled when we switch back from our favorite IDE to the Unity Editor. However, the C# code is not converted directly into Machine Code, as we would expect static compilers to do if we are using languages such as C++.
Instead, the code is converted into an intermediate stage called Common Intermediate Language (CIL), which is an abstraction above Native Code. This is how .NET can support multiple languages--each uses a different compiler, but they're all converted into CIL, so the output is effectively the same regardless of the language that we pick. CIL is similar to Java bytecode, upon which it is based, and the CIL code is entirely useless on its own, as CPUs have no idea how to run the instructions defined in this language.
At runtime, this intermediate code is run through the Mono Virtual Machine (VM), which is an infrastructure element that allows the same code to run against multiple platforms without the need to change the code itself. This is an implementation of the .NET Common Language Runtime (CLR). If we're running on iOS, we run on the iOS-based Virtual Machine infrastructure, and if we're running on Linux, then we simply use a different one that is better suited for Linux. This is how Unity allows us to write code once, and it works magically on multiple platforms.
Within the CLR, the intermediate CIL code will actually be compiled into Native Code on demand. This immediate Native compilation can be accomplished either by an Ahead-Of-Time (AOT) or Just-In-Time (JIT) compiler. Which one is used will depend on the platform that is being targeted. These compilers allow code segments to be compiled into Native Code, allowing the platform's architecture to complete the written instructions without having to write them ourselves. The main difference between the two compiler types is when the code is compiled.
AOT compilation is the typical behavior for code compilation and happens early (ahead of time) either during the build process or in some cases during app initialization. In either case, the code has been precompiled and no further runtime costs are inflicted due to dynamic compilation since there are always Machine Code instructions available whenever the CPU needs them.
JIT compilation happens dynamically at runtime in a separate thread and begins just prior to execution (just in time for execution). Often, this dynamic compilation causes the first invocation of a piece of code to run a little (or a lot) more slowly, because the code must finish compiling before it can be executed. However, from that point forward, whenever the same code block is executed, there is no need for recompilation, and the instructions run through the previously compiled Native Code.
A common adage in software development is that 90 percent of the work is being done by only 10 percent of the code. This generally means that JIT compilation turns out to be a net positive on performance than if we simply tried to interpret the CIL code directly. However, because the JIT compiler must compile code quickly, it is not able to make use of many optimization techniques that static AOT compilers are able to exploit.
A common adage in software development is that 90 percent of the work is being done by only 10 percent of the code. This generally means that JIT compilation turns out to be a net positive on performance than if we simply tried to interpret the CIL code directly. However, because the JIT compiler must compile code quickly, it is not able to make use of many optimization techniques that static AOT compilers are able to exploit.
https://docs.unity3d.com/Manual/ScriptingRestrictions.html
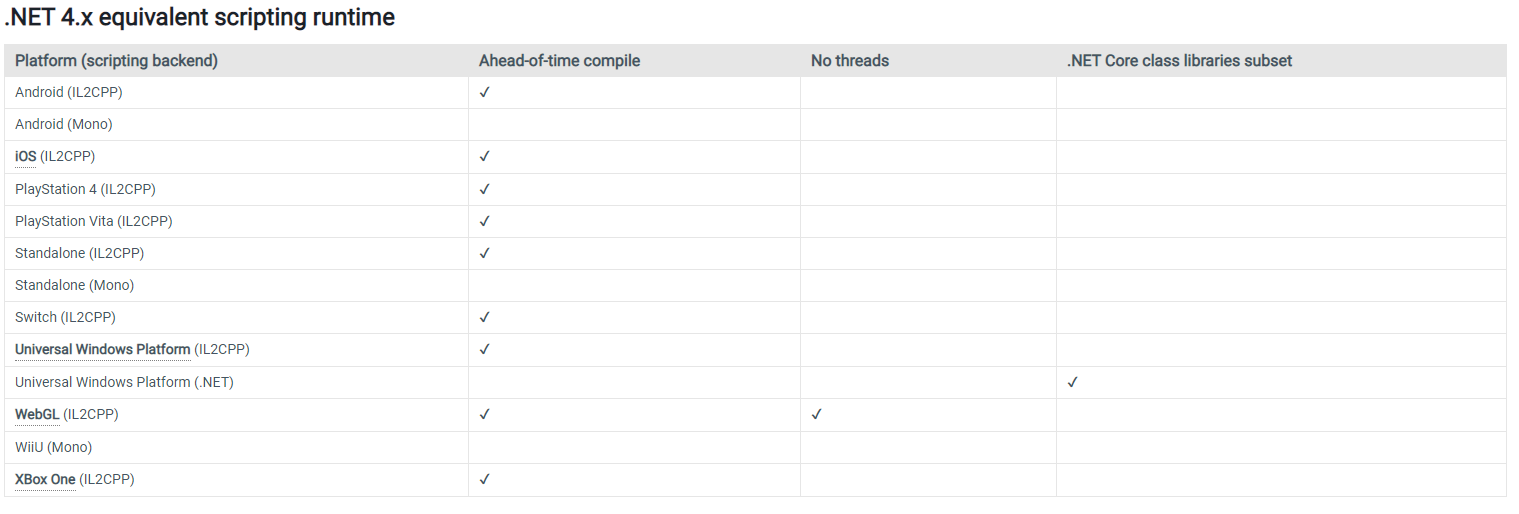

Ahead-of-time compile
Some platforms do not allow runtime code generation. Therefore, any managed code which depends upon just-in-time (JIT) compilation on the target device will fail. Instead, you need to compile all of the managed code ahead-of-time (AOT). Often, this distinction doesn’t matter, but in a few specific cases, AOT platforms require additional consideration.
System.Reflection.Emit
An AOT platform cannot implement any of the methods in the System.Reflection.Emit namespace. The rest of System.Reflection is acceptable, as long as the compiler can infer that the code used via reflection needs to exist at runtime.
Serialization
AOT platforms can encounter issues with serialization and deserlization due to the use of reflection. If a type or method is only used via reflection as part of serialization or deserialization, the AOT compiler cannot detect that the code needs to be generated for the type or method.
Generic virtual methods
Generic methods require the compiler to do some additional work to expand the code written by the developer to the code executed on the device. For example, you need different code for List with an int or a double. In the presence of virtual methods, where behavior is determined at runtime rather than compile time, the compiler can easily require runtime code generation in places where it is not entirely obvious from the source code.
Calling managed methods from native code
Managed methods that need to be marshaled to a C function pointer so that they can be called from native code have a few restructions on AOT platforms:
- The managed method must be a static method
- The managed method must have the [MonoPInvokeCallback] attribute
No threads
Some platforms do not support the use of threads, so any managed code that uses the System.Threading namespace will fail at runtime. Also, some parts of the .NET class libraries implicitly depend upon threads. An often-used example is the System.Timers.Timer class, which depends on support for threads.
Exception filters
IL2CPP does not support C# exception filters. You should modify the code that depends on exception filters into the proper catch blocks.
IL2CPP
https://blogs.unity3d.com/2014/05/20/the-future-of-scripting-in-unity/
IL2CPP(Intermediate Language to C++) is a scripting backend designed to convert Mono's CIL output directly into Native C++ code. This leads to improved performance since the application will now be running Native Code. This ultimately gives Unity Technologies more control of runtime behavior since IL2CPP provides its own AOT compiler and VM, allowing custom improvements to subsystems such as the GC and compilation process. IL2CPP does not intend to completely replace the Mono platform, but it is an additional tool we can enable, which improves part of the functionality that Mono provides.
https://docs.unity3d.com/Manual/ManagedCodeDebugging.html
Profiling memory
There are two issues we are concerned about when it comes to memory management: how much we're consuming, and how often we're allocating new blocks
Profiling memory consumption
Native memory allocations show up under the values labeled Unity, and we can even get more information using Detailed Mode and sampling the current frame

Under the Scene Memory section of Breakdown View, we can observe that MonoBehaviour objects always consume a constant amount of memory, regardless of their member data. This is the memory consumed by the Native representation of the object
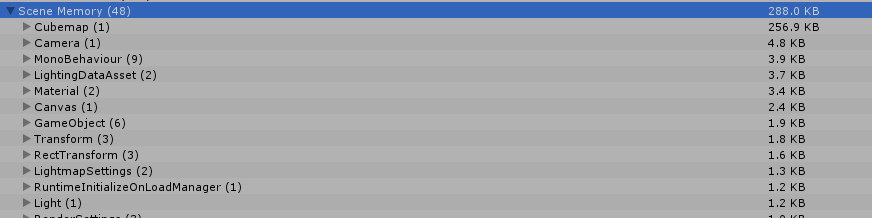
Note that memory consumption in Edit Mode is always wildly different to that of a stand-alone version due to various debugging and editor hook data being applied. This adds a further incentive to avoid using Edit Mode for benchmarking and instrumentation purposes
We can also use the Profiler.GetRuntimeMemorySize() method to get the Native memory allocation size of a particular object
Managed object representations are intrinsically linked to their Native representations. The best way to minimize our Native memory allocations isto simply optimize our Managed memory usage
We can verify how much memory has been allocated and reserved for the Managed Heap using the Memory Area of the Profiler window, under the values labeled Mono, as follows:

We can also determine the current used and reserved heap space at runtime using the Profiler.GetMonoUsedSize() and Profiler.GetMonoHeapSize() methods, respectively
Profiling memory efficiency
The best metric we can use to measure the health of our memory management is simply watching the behavior of the GC. The more work it's doing, the more waste we're generating and the worse our application's performance is likely to become.
We can use both the CPU Usage Area (the GarbageCollector checkbox) and Memory Area (the GC Allocated checkbox) of the Profiler window to observe the amount of work the GC is doing and the time it is doing it. This can be relatively straightforward for some situations, where we only allocated a temporary small block of memory or we just destroyed a GameObject.
However, root-cause analysis for memory efficiency problems can be challenging and time-consuming. When we observe a spike in the GC's behavior, it could be a symptom of allocating too much memory in a previous frame and merely allocating a little more in the current frame, requiring the GC to scan a lot of fragmented memory, determine whether there is enough space, and decide whether to allocate a new block. The memory it cleaned up could have been allocated a long time ago, and we may only be able to observe these effects when our application runs over long periods of time and could even happen when our Scene is sitting relatively idle, giving no obvious cause for the GC to suddenly trigger. Even worse, the Profiler can only tell us what happened in the last few seconds or so, and it won't be immediately obvious what data was being cleaned up.
We must be vigilant and test our application rigorously, observing its memory behavior while simulating a typical play session if we want to be certain we are not generating memory leaks or creating a situation where the GC has too much work to complete in a single frame.
Memory management performance enhancements
Garbage collection tactics
One strategy to minimize garbage collection problems is concealment by manually invoking the GC at opportune moments, when we're certain the player would not notice. Garbage collection can be manually invoked by calling System.GC.Collect()
Good opportunities to invoke a collection may be while loading between levels, when gameplay is paused, shortly after a menu interface has been opened, during cutscene transitions, or any break in Gameplay that the player would not witness, or care about, a sudden performance drop. We could even use the Profiler.GetMonoUsedSize() and Profiler.GetMonoHeapSize() methods at runtime to determine whether a garbage collection needs to be invoked in the near future.
We can also cause the deallocation of a handful of specific objects. If the object in question is one of the Unity object wrappers, such as a GameObject or MonoBehaviour Component, then the finalizer will first invoke the Dispose() method within the Native Domain. At this point, the memory consumed by both the Native and Managed Domains will then be freed. In some rare instances, if the Mono wrapper implements the IDisposable Interface Class (that is, it has a Dispose() method available from script code), then we can actually control this behavior and force the memory to be freed instantly.
There are a number of different object types in the Unity Engine (most of which are introduced in Unity 5 or later), which implement the IDisposable Interface Class, as follows: NetworkConnection, WWW, UnityWebRequest, UploadHandler, DownloadHandler, VertexHelper, CullingGroup, PhotoCapture, VideoCapture, PhraseRecognizer and more.
These are all utility classes for pulling in potentially large datasets where we might want to ensure immediate destruction of the data it has acquired, since they normally involve allocating several buffers and memory blocks in theNative Domain in order to accomplish their tasks. If we kept all of this memory for a long time, it would be a colossal waste of precious space. So, by calling their Dispose() method from script code, we can ensure that the memory buffers are freed promptly and precisely when they need to be.
All other Asset objects offer some kind of unloading method to clean up any unused asset data, such as Resources.UnloadUnusedAssets(). Actual asset data is stored within the Native Domain, so the GC technically isn't involved here, but the idea is basically the same. It will iterate through all Assets of a particular type, check whether they're no longer being referenced, and, if so, deallocate them. However, again, this is an asynchronous process, and we cannot guarantee exactly when the deallocation will occur. This method is
automatically called internally after a Scene is loaded, but this still doesn't guarantee instant deallocation. The preferred approach is to use Resources.UnloadAsset() instead, which will unload one specific asset at a time. This method is generally faster since time will not be spent iterating through an entire collection of asset data, in order to figure out what isunused.
However, the best strategy for garbage collection will always be avoidance; if we allocate as little heap memory and control its usage as much as possible, then we won't have to worry about the GC inflicting frequent, expensive performance costs
Manual JIT compilation
In the event that JIT compilation is causing a runtime performance loss, be aware that it is actually possible to force JIT compilation of a method at any time via Reflection. Reflection is a useful feature of the C# language that allows our code base to explore itself introspectively for type information, methods, values, and metadata. Using Reflection is often a very costly process. It should be avoided at runtime or, at the very least, only used during initialization or other loading times. Not doing so can easily cause significant
CPU spikes and Gameplay freezing.
We can manually force JIT compilation of a method using Reflection to obtain a function pointer to it:
var method = typeof(MyComponent).GetMethod("MethodName");
if (method != null) {
method.MethodHandle.GetFunctionPointer();
Debug.Log("JIT compilation complete!");
}
The preceding code only works on public methods. Obtaining private or protected methods can be accomplished through the use of BindingFlags:
using System.Reflection;
// ...
var method = typeof(MyComponent).GetMethod("MethodName",BindingFlags.NonPublic | BindingFlags.Instance);
This kind of code should only be run for very targeted methods where we are certain that JIT compilation is causing CPU spikes. This can be verified by restarting the application and profiling a method's first invocation versus all subsequent invocations. The difference will tell us the JIT compilation overhead
Note that the official method for forcing JIT compilation in the .NET library is RuntimeHelpers.PrepareMethod(), but this is not properly implemented in the current version of Mono that comes with Unity (Mono Version 2.6.5). The aforementioned workaround should be used until Unity has pulled in a morerecent version of the Mono project.
Value types and Reference types
The .NET Framework has the concept of Value types and Reference types, and only the latter needs to be marked by the GC while it is performing its Mark-and-Sweep algorithm. Large datasets, and any kind of object instantiated from a class, is a Reference type. This also includes arrays (regardless of whether it is an array of Value types or Reference types), delegates, all classes, such as MonoBehaviour, GameObject, and any custom classes we define
Reference types are always allocated on the heap, whereas Value types can be allocated either on the stack or the heap
public class TestComponent {
    void TestFunction() {
        int data = 5; // allocated on the stack
        DoSomething(data);
    } // integer is deallocated from the stack here
}

public class TestComponent : MonoBehaviour {
    private int _data = 5;
    void TestFunction() {
        DoSomething(_data);
    }
}

public class TestData {
    public int data = 5;
}

public class TestComponent {
    void TestFunction() {
        TestData dataObj = new TestData(); // allocated on the heap
        DoSomething(dataObj.data);
    } // dataObj is not immediately deallocated here, but it will
       // become a candidate during the next GC sweep
}
public class TestComponent {
private TestData _testDataObj;void TestFunction() {
TestData dataObj = new TestData(); // allocated on the heap
DoSomething(dataObj.data);
}
void DoSomething (TestData dataObj) {
_testDataObj = dataObj; // a new reference created! The referenced
// object will now be marked during Mark-and-Sweep
}
}
In this case, we would not be able to deallocate the object pointed to dataObj as soon as the TestFunction() method ends because the total number of things referencing the object would go from 2 to 1. This is not 0, and hence the GC would still mark it during Mark-and-Sweep. We would need to set the value of _testDataObj to null or make it reference something else, before the object is no longer reachable.
public class TestClass {
private int[] _intArray = new int[1000]; // Reference type
// full of Value types
void StoreANumber(int num) {
_intArray[0] = num; // store a Value within the array
}
}
When the StoreANumber() method is called, the value of num is merely copied into the zeroth element of the array rather than storing a reference to it
Pass by value and by reference
An important difference between Value types and Reference types is that a Reference type is merely a pointer to another location in memory that consumes only 4 or 8 bytes in memory (32 bit or 64 bit, depending on the architecture), regardless of what it is actually pointing to. When a Reference type is passed as an argument, it is only the value of this pointer that gets copied into the function. Even if the Reference type points to a humongous array of data, this operation will be very quick since the data being copied is very small.
Meanwhile, a Value type contains the full and complete bits of data stored within a concrete object. Hence, all of the data of a Value type will be copied whenever they are passed between methods or stored in other Value types
void Start() {
int myInt = 5;
DoSomething(ref myInt);
Debug.Log(String.Format("Value = {0}", myInt));
}
void DoSomething(ref int val) {
val = 10;
}
Structs are Value types
Arrays are Reference types
Strings are immutable Reference types
String concatenation
StringBuilder
String formatting
Boxing
The importance of data layout
Arrays from the Unity API
There are several instructions within the Unity API that result in heap memory allocations, which we should be aware of. This essentially includes everything that returns an array of data. For example, the following methods allocate memory on the heap:
GetComponents<T>(); // (T[])
Mesh.vertices; // (Vector3[])
Camera.allCameras; // (Camera[])
Each and every time we call a Unity API method that returns an array, will cause a whole new version of that data to be allocated. Such methods should be avoided whenever possible or at the very least called once and cached so that we don't cause memory allocations more often than necessary
Using InstanceIDs for dictionary keys
Object.GetInstanceID(), which returns an integer representing a unique identification value for that object that never changes and is never reused between two objects during the entire lifecycle of the application. If we cache this value in the object somehow and use it as the key in our dictionary, then the element comparison will be around two to three times faster than if we used the object reference directly
foreach loops
The foreach loop keyword is a bit of a controversial issue in Unity development circles. It turns out that a lot of foreach loops implemented in Unity C# code will incur unnecessary heap memory allocations during these calls, as they allocate an Enumerator object as a class on the heap, instead of a struct on the stack. It all depends on the given collection's implementation of the GetEnumerator() method.
It turns out that every single collection that has been implemented in the version of Mono that comes with Unity (Mono version 2.6.5) will create classes instead of structs, which results in heap allocations. This includes, but is not limited to, List<T>, LinkedList<T>, Dictionary<K,V>, and ArrayList.
The cost is fairly negligible, as the heap allocation cost does not scale with the number of iterations. Only one Enumerator object is allocated, and reused over and over again, which only costs a handful of bytes of memory overall. So, unless our foreach loops are being invoked for every update (which is typically dangerous in, and of, itself), the costs will be mostly negligible on small projects. The time taken to convert everything to a for loop may not be worth the time. However, it's definitely something to keep in mind for the
next project we begin to write.
If we're particularly savvy with C#, Visual Studio, and manual compilation of the Mono assembly, then we can have Visual Studio perform code compilation for us and copy the resulting assembly DLL into the Assets folder, which will fix this mistake for the generic collections.
Coroutines
As mentioned before, starting a Coroutine costs a small amount of memory to begin with, but note that no further costs are incurred when the method calls yield. If memory consumption and garbage collection are significant concerns, we should try to avoid having too many short-lived Coroutines and avoid calling StartCoroutine() too much during runtime.
Closures
Closures are useful, but dangerous tools. Anonymous methods and lambda expressions are not always Closures, but they can be. It all depends on whether the method uses data outside of its own scope and parameter list or not.
For example, the following anonymous function would not be a Closure, since it is self-contained and functionally equivalent to any other locally defined function:
System.Func<int,int> anon = (x) => { return x; };
int result = anon(5); // result = 5
However, if the anonymous function pulled in data from outside itself, it becomes a Closure, as it closes the environment around the required data. The following would result in a Closure:
int i = 1024;
System.Func<int,int> anon = (x) => { return x + i; };
int result = anon(5);
In order to complete this transaction, the compiler must define a new custom class that can reference the environment where the data value i would be accessible. At runtime, it creates the corresponding object on the heap and provides it to the anonymous function. Note that this includes Value types (as per the above example), which were originally on the stack, possibly defeating the purpose of them being allocated on the stack in the first place. So, we should expect each invocation of the second method to result in heap
allocations and inevitable garbage collection.
The .NET library functions
It may be possible to replace a particular .NET library class with a custom implementation that is more suited to our specific use case
LINQ provides a way to treat arrays of data as miniature databases and perform queries against them using a SQL-like syntax. The simplicity of its coding style and complexity of the underlying system (through its usage of Closures) implies that it has a fairly large overhead cost. LINQ is a handy tool, but is not really intended for high-performance, real-time applications, such as games, and does not even function on platforms that do not support JIT compilation, such as iOS.
Meanwhile, Regular Expressions through the Regex class allow us to perform complex string parsing to find substrings that match a particular format,replace pieces of a string, or construct strings from various inputs. Regular Expression is another very useful tool, but tends to be overused in places where it is largely unnecessary or in so-called clever ways to implement a feature such as text localization, when straightforward string replacement would be far more efficient.
Temporary work buffers
If we get into the habit of using large, temporary work buffers for one task or another, then it just makes sense that we should look for opportunities to reuse them, instead of reallocating them over and over again, as this lowers the overhead involved in allocation and garbage collection (often called memory pressure). It might be worthwhile to extract such functionality from case-specific classes into a generic God Class that contains a big work area for multiple classes to reuse
Object Pooling
public interface IPoolableObject{
    void New();
    void Respawn();
}

using System.Collections.Generic;

public class ObjectPool<T> where T : IPoolableObject, new() {
    private Stack<T> _pool;
    private int _currentIndex = 0;

    public ObjectPool(int initialCapacity) {
        _pool = new Stack<T>(initialCapacity);

        for(int i = 0; i < initialCapacity; ++i) {Spawn (); //    instantiate a pool of N objects
        }

        Reset ();
    }

    public int Count {
        get { return _pool.Count; }
    }

    public void Reset() {
        _currentIndex = 0;
    }

    public T Spawn() {
        if (_currentIndex < Count) {
            T obj = _pool.Peek ();
            _currentIndex++;
            IPoolableObject po = obj as IPoolableObject;
            po.Respawn();
            return obj;
        } else {
            T obj = new T();
            _pool.Push(obj);
            _currentIndex++;
            IPoolableObject po = obj as IPoolableObject;
            po.New();
            return obj;
        }
    }
}


public class TestObject : IPoolableObject {
    public void New() {
        // very first initialization here
    }

    public void Respawn() {
        // reset data which allows the object to be recycled here
    }
}
Prefab Pooling
Poolable Components
The Prefab Pooling System
Prefab poolsObject spawning
Instance prespawning
Object despawning
Prefab pool testing
Prefab Pooling and Scene loading
Prefab Pooling summary
IL2CPP optimizations
WebGL optimizations
The future of Unity, Mono, and IL2CPP
The upcoming C# Job System
Summary
9. Tactical Tips and Tricks
Editor hotkey tips
GameObjects
Scene window
Arrays
Interface
In-editor documentation
Editor UI tips
Script Execution Order
Editor files
The Inspector window
The Project window
The Hierarchy window
The Scene and Game windows
Play Mode
Scripting tips
General
Attributes
Variable attributes
Class attributes
Logging
Useful links
Custom Editor scripts and menu tips
External tips
Other tips
Summary