Although a lot of new tools have arrived since 2011, it's clear that older open source tools like Nagios, and Nagios alternatives like Zabbix and Icinga, still dominate the market, with 70% of the companies we spoke to still using these tools for their core monitoring & alerting.
Around 70% of the companies used more than one monitoring tool, with most using an average of two. Nagios/Graphite configurations were most common, with many also using New Relic. However, only two of the companies we spoke to actually paid for New Relic, with most of the companies using the free version as they found the paid version too expensive.
In the "other" category, there were a lot of different tools with no particular one standing out. Types of tools that fell into this category were SaaS monitoring tools such as Librato & Datadog, used by several smaller start-ups, or many older open source tools like Cacti or Munin. Some AWS users rely on CloudWatch, and there were even a few custom built solutions.

Graph 1: Percentage of companies with monitoring tools deployed.
If we look at tool usage versus the number of servers the companies manage (< 20 being new startup services, and all the way to > 1000 servers for the large online services), you can see that the proportion of older open source tools like Nagios, or paid on-premise tools goes up as the service gets larger, whereas the smaller, newer services are more likely to use developer focused tools like Graphite, LogStash and New Relic.
This makes sense, as many of the larger services are older (> 5 years old) so have legacy monitoring infrastructure, and also have the resources to hire a dedicated operations team who tend to bring in the tools their most familiar with, namely Nagios or Nagios alternatives. They also have more money to pay for monitoring tools like Splunk (which everyone would love to have if they could afford it) or AppDynamics.
The newer smaller services tend not to have any DevOps/Operations people in their company, so developers tend to use simpler-to-install SaaS monitoring tools, or tools that help them such as Graphite or LogStash. There seems to be a tipping point between 50-100 servers when the company has the resources to bring in a DevOps/Operations person or team and they start bringing in the infrastructure monitoring tools like Nagios to provide the coverage they need.
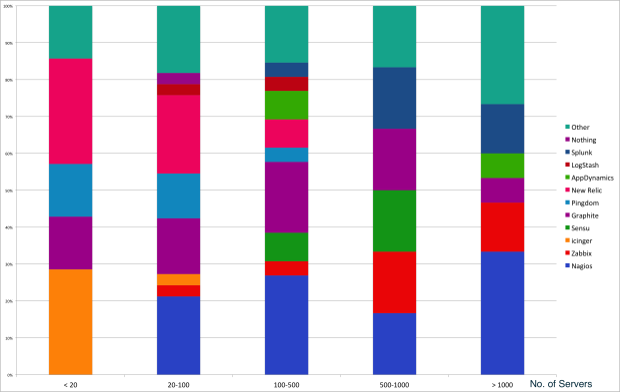
Graph 2: Tool Usage vs. Number of Servers Managed
Key Trends:
1. Many people found the newer services lacked the flexibility of open source solutions with their ability to customize them to their requirements, and didn't like the idea of learning a proprietary system with its own plugin design and features. So they built their own "kit car".
2. While the services became larger, the trend was the move towards microservices, with different cross-functional development teams building, deploying and supporting their own parts of the service.
3. There are some simpler things that can be done to reduce spammy alerts with potential of predictive & more intelligent alerting using machine learning.
[excerpt from Outlyer]