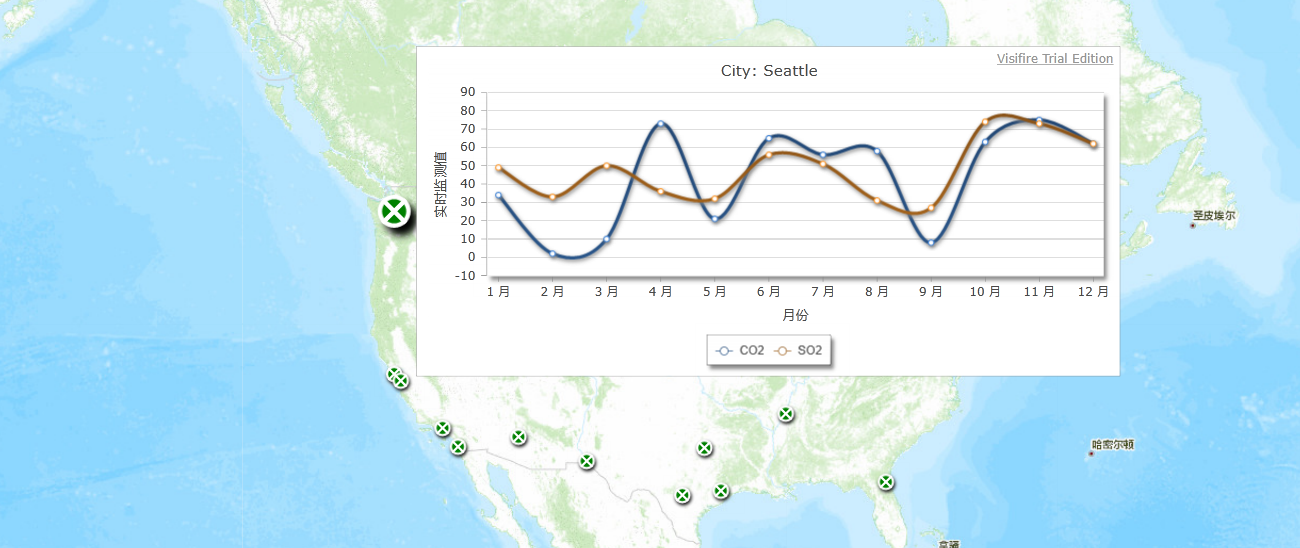
首先来看一看实现的效果:
 1 <UserControl
 2     xmlns="http://schemas.microsoft.com/winfx/2006/xaml/presentation"
 3     xmlns:x="http://schemas.microsoft.com/winfx/2006/xaml"
 4     xmlns:d="http://schemas.microsoft.com/expression/blend/2008"
 5     xmlns:mc="http://schemas.openxmlformats.org/markup-compatibility/2006"
 6     xmlns:esri="http://schemas.esri.com/arcgis/client/2009"
 7     xmlns:vsm="clr-namespace:System.Windows;assembly=System.Windows"
 8     xmlns:vc="clr-namespace:Visifire.Charts;assembly=SLVisifire.Charts"
 9     x:Class="VisifireDemo.MainPage"
10     mc:Ignorable="d"
11     d:DesignHeight="300" d:DesignWidth="400">
12
13     <Grid x:Name="LayoutRoot" Background="White">
14         <Grid.Resources>
15             <esri:SimpleRenderer x:Key="MySimplePointRenderer">
16                 <esri:SimpleRenderer.Symbol>
17                     <esri:SimpleMarkerSymbol Size="15" Style="Circle">
18                         <esri:SimpleMarkerSymbol.ControlTemplate>
19                             <ControlTemplate>
20                                 <Grid x:Name="RootElement" RenderTransformOrigin="0.5,0.5" Width="15" Height="15">
21                                     <Grid.RenderTransform>
22                                         <ScaleTransform x:Name="customEnlargeRotatingMarkerSymbolScale" ScaleX="1" ScaleY="1" />
23                                     </Grid.RenderTransform>
24                                     <Grid.Resources>
25                                         <DropShadowEffect x:Key="customEnlargeRotatingMarkerSymbolEffect" />
26                                     </Grid.Resources>
27                                     <vsm:VisualStateManager.VisualStateGroups>
28                                         <vsm:VisualStateGroup x:Name="CommonStates">
29                                             <vsm:VisualState x:Name="Normal">
30                                                 <Storyboard>
31                                                     <DoubleAnimation BeginTime="00:00:00" Storyboard.TargetName="customEnlargeRotatingMarkerSymbolScale" Storyboard.TargetProperty="ScaleX" To="1" Duration="0:0:0.2" />
32                                                     <DoubleAnimation BeginTime="00:00:00" Storyboard.TargetName="customEnlargeRotatingMarkerSymbolScale" Storyboard.TargetProperty="ScaleY" To="1" Duration="0:0:0.2" />
33                                                     <DoubleAnimation BeginTime="00:00:00" Storyboard.TargetName="customEnlargeRotatingMarkerSymbolRotate" Storyboard.TargetProperty="Angle" To="360" Duration="0:0:0.2" />
34                                                     <DoubleAnimation BeginTime="00:00:00" Storyboard.TargetName="ellipse" Storyboard.TargetProperty="(UIElement.Effect).(DropShadowEffect.ShadowDepth)" To="2" Duration="0:0:0.2" />
35                                                 </Storyboard>
36                                             </vsm:VisualState>
37                                             <vsm:VisualState x:Name="MouseOver">
38                                                 <Storyboard>
39                                                     <DoubleAnimation BeginTime="00:00:00" Storyboard.TargetName="customEnlargeRotatingMarkerSymbolScale" Storyboard.TargetProperty="ScaleX" To="2" Duration="0:0:0.2" />
40                                                     <DoubleAnimation BeginTime="00:00:00" Storyboard.TargetName="customEnlargeRotatingMarkerSymbolScale" Storyboard.TargetProperty="ScaleY" To="2" Duration="0:0:0.2" />
41                                                     <DoubleAnimation BeginTime="00:00:00" Storyboard.TargetName="customEnlargeRotatingMarkerSymbolRotate" Storyboard.TargetProperty="Angle" To="0" Duration="0:0:0.2" />
42                                                     <DoubleAnimation BeginTime="00:00:00" Storyboard.TargetName="ellipse" Storyboard.TargetProperty="(UIElement.Effect).(DropShadowEffect.ShadowDepth)" To="5" Duration="0:0:0.2" />
43                                                 </Storyboard>
44                                             </vsm:VisualState>
45                                         </vsm:VisualStateGroup>
46                                     </vsm:VisualStateManager.VisualStateGroups>
47                                     <Ellipse x:Name="ellipse" Width="15" Height="15" Fill="Green" Stroke="White" StrokeThickness="2" HorizontalAlignment="Center" VerticalAlignment="Center" Effect="{StaticResource customEnlargeRotatingMarkerSymbolEffect}"></Ellipse>
48                                     <Canvas x:Name="RotateCanvas" HorizontalAlignment="Left" VerticalAlignment="Top" Width="15" Height="15" RenderTransformOrigin="0.5,0.5">
49                                         <Canvas.Clip>
50                                             <EllipseGeometry RadiusX="7.5" RadiusY="7.5" Center="7.5,7.5" />
51                                         </Canvas.Clip>
52                                         <Canvas.RenderTransform>
53                                             <RotateTransform x:Name="customEnlargeRotatingMarkerSymbolRotate" Angle="360" />
54                                         </Canvas.RenderTransform>
55                                         <Line Stroke="White" StrokeThickness="2" X1="0" Y1="0" X2="15" Y2="15" />
56                                         <Line Stroke="White" StrokeThickness="2" X1="0" Y1="15" X2="15" Y2="0" />
57                                     </Canvas>
58                                 </Grid>
59                             </ControlTemplate>
60                         </esri:SimpleMarkerSymbol.ControlTemplate>
61                     </esri:SimpleMarkerSymbol>
62
63                 </esri:SimpleRenderer.Symbol>
64             </esri:SimpleRenderer>
65         </Grid.Resources>
66         <esri:Map Background="White" HorizontalAlignment="Stretch" Margin="0" Grid.ColumnSpan="3" Name="Map" VerticalAlignment="Stretch" WrapAround="True" Extent="-15000000,2000000,-7000000,8000000">
67             <esri:Map.Layers>
68                 <esri:LayerCollection>
69                     <esri:ArcGISTiledMapServiceLayer Url="http://www.arcgisonline.cn/ArcGIS/rest/services/ChinaOnlineCommunity/MapServer" />
70                     <esri:FeatureLayer ID="MyFeatureLayer"
71                     Url="http://sampleserver1.arcgisonline.com/ArcGIS/rest/services/Specialty/ESRI_StatesCitiesRivers_USA/MapServer/0"
72                     Where="POP1990 > 500000"
73                                        MouseEnter="FeatureLayer_MouseEnter"
74                                        MouseLeave="FeatureLayer_MouseLeave"
75                                        Renderer="{StaticResource MySimplePointRenderer}"/>
76                 </esri:LayerCollection>
77             </esri:Map.Layers>
78         </esri:Map>
79     </Grid>
80 </UserControl>
  1 using ESRI.ArcGIS.Client;
  2 using ESRI.ArcGIS.Client.Geometry;
  3 using System;
  4 using System.Collections.Generic;
  5 using System.Linq;
  6 using System.Net;
  7 using System.Windows;
  8 using System.Windows.Controls;
  9 using System.Windows.Documents;
 10 using System.Windows.Input;
 11 using System.Windows.Media;
 12 using System.Windows.Media.Animation;
 13 using System.Windows.Shapes;
 14 using Visifire.Charts;
 15
 16 namespace VisifireDemo
 17 {
 18     public partial class MainPage : UserControl
 19     {
 20         public MainPage()
 21         {
 22             InitializeComponent();
 23         }
 24         Chart chart;
 25         Random rand = new Random(DateTime.Now.Millisecond);
 26         System.Windows.Threading.DispatcherTimer timer = new
 27         System.Windows.Threading.DispatcherTimer();
 28         /// <summary>
 29         /// Function to create a Visifire Chart
 30         /// </summary>
 31         public void CreateChart()
 32         {
 33             try
 34             {
 35                 // Create a new instance of a Chart
 36                 chart = new Chart();
 37                 //添加X,Y坐标的描述
 38                 Axis axisX = new Axis()
 39                 {
 40                     Title = "月份",
 41                     FontSize = 18,
 42                 };
 43                 chart.AxesX.Add(axisX);
 44
 45                 Axis axisY = new Axis()
 46                 {
 47                     Title = "实时监测值",
 48                     FontSize = 16,
 49                 };
 50                 chart.AxesY.Add(axisY);
 51
 52                 // 设置图表的高宽
 53                 chart.Width = 640;
 54                 chart.Height = 300;
 55
 56                 //Line数据更新时的过渡效果
 57                 chart.AnimatedUpdate = true;
 58
 59                 // 定义DatatSeries实例,即一条曲线
 60                 DataSeries dataSeries1 = new DataSeries();
 61                 DataSeries dataSeries2 = new DataSeries();
 62                 //只有当Series的个数大于等于2个时Lenged才会生效
 63                 dataSeries1.LegendText = "CO2";
 64                 dataSeries2.LegendText = "SO2";
 65                 // 设置DataSeries样式
 66                 dataSeries1.RenderAs = RenderAs.Spline;
 67                 dataSeries2.RenderAs = RenderAs.Spline;
 68                 // 定义数据点
 69                 DataPoint dataPoint1;
 70                 DataPoint dataPoint2;
 71                 for (int i = 1; i <= 12; i++)
 72                 {
 73                     // 实例化数据点
 74                     dataPoint1 = new DataPoint();
 75                     dataPoint2 = new DataPoint();
 76                     //设置数据值
 77                     dataPoint1.YValue = rand.Next(0, 99);
 78                     dataPoint2.YValue = rand.Next(0, 99);
 79                     //设置X轴显示名称
 80                     dataPoint1.AxisXLabel = string.Format("{0} 月", i);
 81                     dataPoint2.AxisXLabel = string.Format("{0} 月", i);
 82                     // 添加数据点
 83                     dataSeries1.DataPoints.Add(dataPoint1);
 84                     dataSeries2.DataPoints.Add(dataPoint2);
 85                 }
 86
 87                 // 将DataSeries(曲线)添加到Chart中
 88                 chart.Series.Add(dataSeries1);
 89                 chart.Series.Add(dataSeries2);
 90                 // 注册Chart Loaded事件,在该事件中设置Timer的间断值及注册Timer Tick事件
 91                 chart.Loaded += new RoutedEventHandler(chart_Loaded);
 92             }
 93             catch (Exception ex)
 94             {
 95                 MessageBox.Show(ex.ToString());
 96             }
 97         }
 98         void chart_Loaded(object sender, RoutedEventArgs e)
 99         {
100             timer.Tick += new EventHandler(timer_Tick);
101             timer.Interval = new TimeSpan(0, 0, 0, 0, 2000);
102         }
103         /// <summary>
104         /// Event handler for Tick event of Dispatcher Timer
105         /// </summary>
106         /// <param name="sender">System.Windows.Threading.DispatcherTimer</param>
107         /// <param name="e">EventArgs</param>
108         void timer_Tick(object sender, EventArgs e)
109         {
110             for (Int32 i = 0; i < 12; i++)
111             {
112                 // 更新曲线数据
113                 chart.Series[0].DataPoints[i].YValue = rand.Next(0, 99);
114                 chart.Series[1].DataPoints[i].YValue = rand.Next(20, 80);
115             }
116         }
117         /// <summary>
118         /// Add Chart to Map
119         /// </summary>
120         /// <param name="chart">Chart</param>
121         /// <param name="position">Position</param>
122         public void AddChartToMapLayer(Chart chart, Graphic position)
123         {
124             ElementLayer chartlayer = new ElementLayer();
125             chartlayer.ID = "ChartLayer";
126             chartlayer.Opacity = 1;
127             if (Map.Layers["ChartLayer"] != null)
128             {
129                 Map.Layers.Remove(Map.Layers["ChartLayer"]);
130             }
131
132             chart.Titles.Add(new Title()
133             {
134                 Text = string.Format("City: {0}", position.Attributes["CITY_NAME"].ToString())
135             });
136
137             //获得Graphic的中心坐标
138             ESRI.ArcGIS.Client.Geometry.Geometry geometry = position.Geometry;
139             MapPoint mapPoint = new MapPoint((geometry.Extent.XMax + geometry.Extent.XMin) / 2, (geometry.Extent.YMax + geometry.Extent.YMin) / 2);
140
141             //获得图层X,Y方向对应的比例
142             double cell_X = (Map.Extent.XMax - Map.Extent.XMin) / Map.ActualWidth;
143             double cell_Y = (Map.Extent.YMax - Map.Extent.YMin) / Map.ActualHeight;
144
145             //Chart的宽度为500所以,Chart的中心则位于宽度等于250的位置,将Chart向右移动,以防Chart覆盖Graphic
146             Envelope extent = new Envelope(mapPoint.X + (320 + 20) * cell_X, mapPoint.Y, mapPoint.X + (320 + 20) * cell_X, mapPoint.Y);
147             //设置ElementLayer的外包范围
148             ElementLayer.SetEnvelope(chart, extent);
149             chartlayer.Children.Add(chart);
150             Map.Layers.Add(chartlayer);
151         }
152         private void FeatureLayer_MouseEnter(object sender, GraphicMouseEventArgs e)
153         {
154             //绘制Chart
155             CreateChart();
156             //将Chart添加到Map
157             AddChartToMapLayer(chart, e.Graphic);
158             //启动Timer,定时刷新数据
159             timer.Start();
160         }
161
162         private void FeatureLayer_MouseLeave(object sender, GraphicMouseEventArgs e)
163         {
164             //停止Timer
165             timer.Stop();
166             //移除ElementLayer
167             if (Map.Layers["ChartLayer"] != null)
168             {
169                 Map.Layers.Remove(Map.Layers["ChartLayer"]);
170             }
171         }
172     }
173 }
<object width="100%" height="600" data="data:application/x-silverlight-2," type="application/x-silverlight-2"><param name="source"value="http://files.cnblogs.com/aptdo2008/demo.xap" /><param name="onError" value="onSilverlightError" /><param name="background" value="white" /><param name="minRuntimeVersion" value="4.0.50826.0" /><param name="autoUpgrade" value="true" /><param name="src" value="data:application/x-silverlight-2," /><a href="http://go.microsoft.com/fwlink/?LinkID=149156&v=4.0.50826.0" style="text-decoration:none"> <img src="http://go.microsoft.com/fwlink/?LinkId=161376" alt="获取 Microsoft Silverlight" style="border-style:none" /> </a> </object>
将source 的Value值设置成你的xap地址。