首先pycharm里面的代码格式化,也就是所说的美化快捷键【Ctrl+Alt+L】
1、IP地址由范围打印出每个ip地址,业务中有太多的ip需要整理,所以批量处理一下,已做到一步完成大规模的重复步骤
# -*-coding:utf-8-*-
q = open('jieguo.txt', 'w')
f = open('addredd.txt')
for line in f.readlines():
    line = line.strip()
    line = line.split('-')
    val1 = line[0].split('.')
    val2 = line[1].split('.')
    title = '%s.%s.%s.' % (val1[0], val1[1], val1[2])
    ip_start = val1[3]
    ip_end = val2[3]
    # print(title,ip_strat,ip_end)
    for i in range(int(ip_start), int(ip_end) + 1):
        # my_dict = ['%s,%s'%ip_strat,ip_end]
        # print("%s%s" %(title,i))
        q.write('%s%s
' % (title, i))
2、天气网北京昌平地区的天气情况
# 天气网昌平地区爬虫案例
import requests
from lxml import etree


class WeatherSpider:

    def __init__(self):
        # self.url = "http://www.weather.com.cn/weather/101210404.shtml"
        self.url = "http://www.weather.com.cn/weather/101010700.shtml"
        self.headers = {
            "User-Agent": "Mozilla/5.0 (Windows NT 10.0; WOW64) AppleWebKit/537.36 (KHTML, like Gecko) Chrome/72.0.3626.119 Safari/537.36"}

    def get_url_content(self):
        return requests.get(self.url, headers=self.headers).content.decode()

    def get_weather_data(self, html):
        tmp_html = etree.HTML(html)
        tomorrow_doc =
        tmp_html.xpath("//div[contains(@class,'con') and contains(@class,'today')]//div[@class='c7d']/ul/li[2]")[0]
        weather_data = {}
        weather_data["日期"] = tomorrow_doc.xpath("./h1/text()")[0]
        weather_data["天气"] = tomorrow_doc.xpath("./p[@class='wea']/@title")[0]
        weather_data["最高气温"] = tomorrow_doc.xpath("./p[@class='tem']/span/text()")[0]
        weather_data["最低气温"] = tomorrow_doc.xpath("./p[@class='tem']/i/text()")[0]
        weather_data["空速"] = tomorrow_doc.xpath("./p[@class='win']/i/text()")[0]
        return weather_data

    def run(self):
        # 获取url请求内容
        content_html = self.get_url_content()
        # 根据url内容获取天气数据
        data = self.get_weather_data(content_html)
        # 打印爬取的天气数据

        # data_dict = []
        # for i in data:
        #     data_dict.append()
        #     print(data_dict)
        print(data)

if __name__ == '__main__':
    spider = WeatherSpider()
    spider.run()
3、合并多个表格到一个sheet里面
# -*- coding: utf-8 -*-

# 将多个Excel文件合并成一个
import xlrd
import xlsxwriter


# 打开一个excel文件
def open_xls(file):
    fh = xlrd.open_workbook(file)
    return fh


# 获取excel中所有的sheet表
def getsheet(fh):
    return fh.sheets()


# 获取sheet表的行数
def getnrows(fh, sheet):
    table = fh.sheets()[sheet]
    return table.nrows


# 读取文件内容并返回行内容
def getFilect(file, shnum):
    fh = open_xls(file)
    table = fh.sheets()[shnum]
    num = table.nrows
    for row in range(num):
        rdata = table.row_values(row)
        datavalue.append(rdata)
    return datavalue


# 获取sheet表的个数
def getshnum(fh):
    x = 0
    sh = getsheet(fh)
    for sheet in sh:
        x += 1
    return x


if __name__ == '__main__':
    # 定义要合并的excel文件列表
    allxls = ['F:/test/excel1.xlsx', 'F:/test/excel2.xlsx']
    # 存储所有读取的结果
    datavalue = []
    for fl in allxls:
        fh = open_xls(fl)
        x = getshnum(fh)
        for shnum in range(x):
            print("正在读取文件:" + str(fl) + "的第" + str(shnum) + "个sheet表的内容...")
            rvalue = getFilect(fl, shnum)
    # 定义最终合并后生成的新文件
    endfile = 'F:/test/excel3.xlsx'
    wb1 = xlsxwriter.Workbook(endfile)
    # 创建一个sheet工作对象
    ws = wb1.add_worksheet()
    for a in range(len(rvalue)):
        for b in range(len(rvalue[a])):
            c = rvalue[a][b]
            ws.write(a, b, c)
    wb1.close()
    print("文件合并完成")
4、对比两个文本,查找不同的信息
# coding=utf-8
import re

oldt = []
newt = []
f = open('new', encoding='utf-8')
for a in f.readlines():
    a = a.strip()
    newt.append(a)
f.close()
q = open('old', encoding='utf-8')
for b in q.readlines():
    b = b.strip()
    oldt.append(b)
q.close()

for i in newt:
    if i in oldt:
        pass
    else:
        print('%s' % i)
5、柱状图
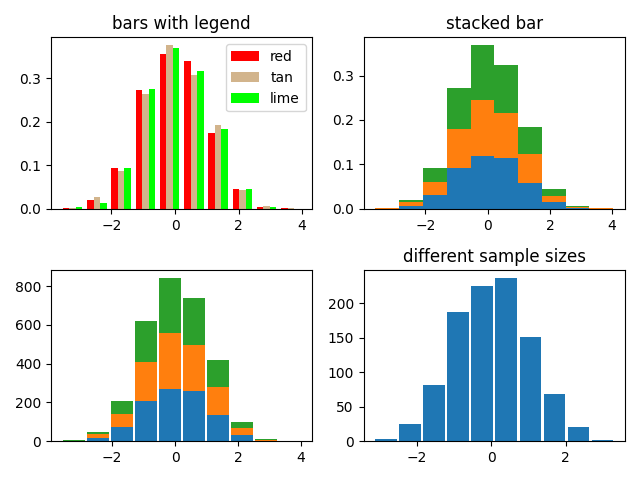
import numpy as np
import matplotlib.pyplot as plt

np.random.seed(19680801)

n_bins = 10
x = np.random.randn(1000, 3)

fig, axes = plt.subplots(nrows=2, ncols=2)
ax0, ax1, ax2, ax3 = axes.flatten()

colors = ['red', 'tan', 'lime']
ax0.hist(x, n_bins, density=True, histtype='bar', color=colors, label=colors)
ax0.legend(prop={'size': 10})
ax0.set_title('bars with legend')

ax1.hist(x, n_bins, density=True, histtype='barstacked')
ax1.set_title('stacked bar')

ax2.hist(x,  histtype='barstacked', rwidth=0.9)

ax3.hist(x[:, 0], rwidth=0.9)
ax3.set_title('different sample sizes')

fig.tight_layout()
plt.show()
6、饼图
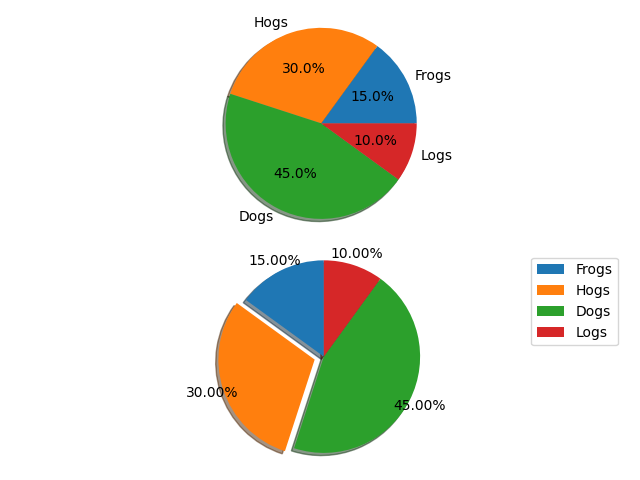
# -*- coding:utf-8 -*-

import matplotlib.pyplot as plt

labels = 'Frogs', 'Hogs', 'Dogs', 'Logs'
sizes = [15, 30, 45, 10]
explode = (0, 0.1, 0, 0)  # only "explode" the 2nd slice (i.e. 'Hogs')

fig1, (ax1, ax2) = plt.subplots(2)
ax1.pie(sizes, labels=labels, autopct='%1.1f%%', shadow=True)
ax1.axis('equal')
ax2.pie(sizes, autopct='%1.2f%%', shadow=True, startangle=90, explode=explode,
    pctdistance=1.12)
ax2.axis('equal')
ax2.legend(labels=labels, loc='upper right')

plt.show()
7、柱状图
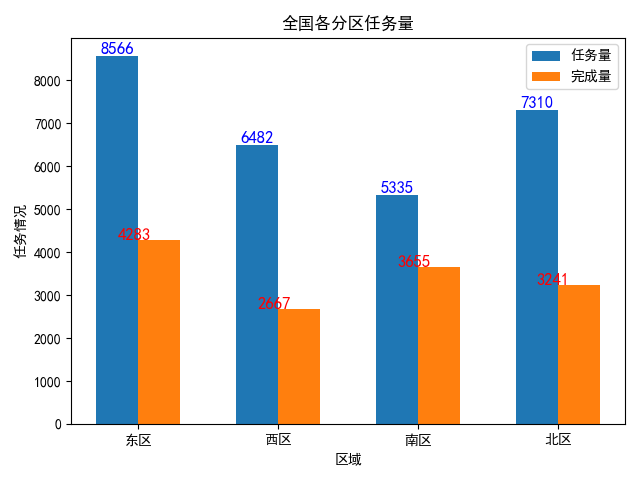
# -*- coding:utf-8 -*-

import numpy as np
import matplotlib.pyplot as plt

plt.subplot(1, 1, 1)

x = np.array([1, 2, 3, 4])
y1 = np.array([8566, 6482, 5335, 7310])
y2 = np.array([4283, 2667, 3655, 3241])

plt.bar(x, y1, width=0.3, label="任务量")
plt.bar(x + 0.3, y2, width=0.3, label="完成量")
# x+0.3相当于完成量的每个柱子右移0.3

plt.title("全国各分区任务量", loc="center")

# 添加数据标签
for a, b in zip(x, y1):
    plt.text(a, b, b, ha='center', va="bottom", fontsize=12, color="blue")

for a, b in zip(x, y2):
    plt.text(a, b, b, ha='left', va="baseline", fontsize=12, color="r")

plt.xlabel('区域')
plt.ylabel('任务情况')

# 设置x轴刻度值
plt.xticks(x + 0.15, ["东区", "西区", "南区", "北区"])

plt.rcParams['font.sans-serif']=['SimHei'] #显示中文标签
plt.rcParams['axes.unicode_minus']=False   #这两行需要手动设置

plt.grid(False)
plt.legend()  # 显示图例
plt.show()
8、折线图
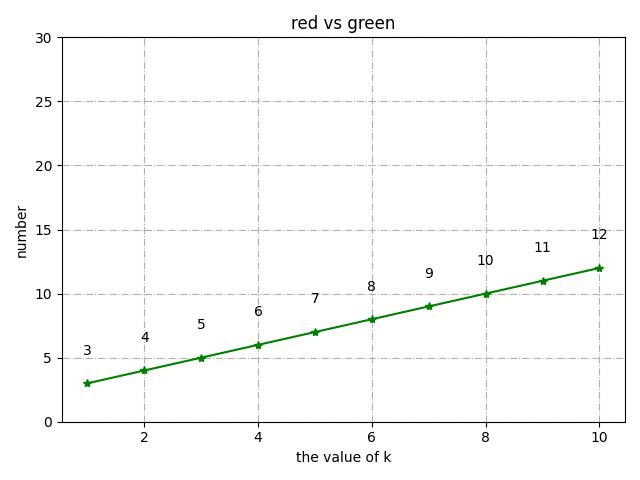
import numpy as np
import random
import xlrd
import xlwt

import matplotlib.pyplot as plt
from mpl_toolkits.mplot3d import Axes3D

x=[1,2,3,4,5,6,7,8,9,10]
y=[3,4,5,6,7,8,9,10,11,12]

plt.grid(True,linestyle = "-.")

plt.plot(x,y,marker='*',color='green')

# 设置数字标签
for a, b in zip(x, y):
    plt.text(a, b+2, b, ha='center', va='bottom', fontsize=10)

plt.ylim(0,30)
plt.xlabel('the value of k')
plt.ylabel('number')
plt.title('red vs green')
plt.show()
9、数据生成Excel
# -*- coding:utf-8 -*-

import xlsxwriter

# 创建一个excel
workbook = xlsxwriter.Workbook("../z周联系/chart_line.xlsx")
# 创建一个sheet
worksheet = workbook.add_worksheet()
# worksheet = workbook.add_worksheet("bug_analysis")

# 自定义样式,加粗
bold = workbook.add_format({'bold': 1})

# --------1、准备数据并写入excel---------------
# 向excel中写入数据,建立图标时要用到
headings = ['Number', 'testA', 'testB']
data = [
    ['2017-9-1', '2017-9-2', '2017-9-3', '2017-9-4', '2017-9-5', '2017-9-6'],
    [10, 40, 50, 20, 10, 50],
    [30, 60, 70, 50, 40, 30],
]

# 写入表头
worksheet.write_row('A1', headings, bold)

# 写入数据
worksheet.write_column('A2', data[0])
worksheet.write_column('B2', data[1])
worksheet.write_column('C2', data[2])

# --------2、生成图表并插入到excel---------------
# 创建一个柱状图(line chart)
chart_col = workbook.add_chart({'type': 'line'})

# 配置第一个系列数据
chart_col.add_series({
    # 这里的sheet1是默认的值,因为我们在新建sheet时没有指定sheet名
    # 如果我们新建sheet时设置了sheet名,这里就要设置成相应的值
    'name': '=Sheet1!$B$1',
    'categories': '=Sheet1!$A$2:$A$7',
    'values':   '=Sheet1!$B$2:$B$7',
    'line': {'color': 'red'},
})

# 配置第二个系列数据
chart_col.add_series({
    'name': '=Sheet1!$C$1',
    'categories':  '=Sheet1!$A$2:$A$7',
    'values':   '=Sheet1!$C$2:$C$7',
    'line': {'color': 'yellow'},
})

# 配置第二个系列数据(用了另一种语法)
# chart_col.add_series({
#     'name': ['Sheet1', 0, 2],
#     'categories': ['Sheet1', 1, 0, 6, 0],
#     'values': ['Sheet1', 1, 2, 6, 2],
#     'line': {'color': 'yellow'},
# })

# 设置图表的title 和 x,y轴信息
chart_col.set_title({'name': 'The xxx site Bug Analysis'})
chart_col.set_x_axis({'name': 'Test number'})
chart_col.set_y_axis({'name':  'Sample length (mm)'})

# 设置图表的风格
chart_col.set_style(1)

# 把图表插入到worksheet并设置偏移
worksheet.insert_chart('A10', chart_col, {'x_offset': 25, 'y_offset': 10})

workbook.close()