1. 准备预训练好的模型
- TensorFlow 预训练好的模型被保存为以下四个文件
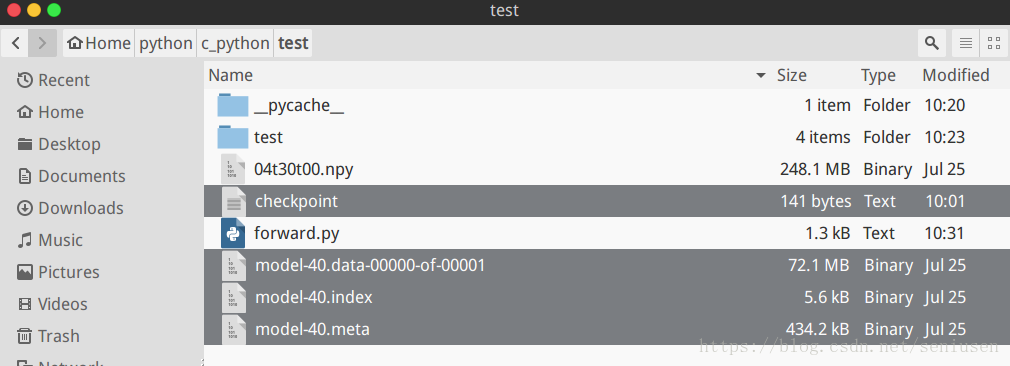
- data 文件是训练好的参数值,meta 文件是定义的神经网络图,checkpoint 文件是所有模型的保存路径,如下所示,为简单起见只保留了一个模型。
model_checkpoint_path: "/home/senius/python/c_python/test/model-40"
all_model_checkpoint_paths: "/home/senius/python/c_python/test/model-40"
2. 导入模型图、参数值和相关变量
import tensorflow as tf
import numpy as np

sess = tf.Session()
X = None # input
yhat = None # output

def load_model():
    """
        Loading the pre-trained model and parameters.
    """
    global X, yhat
    modelpath = r'/home/senius/python/c_python/test/'
    saver = tf.train.import_meta_graph(modelpath + 'model-40.meta')
    saver.restore(sess, tf.train.latest_checkpoint(modelpath))
    graph = tf.get_default_graph()
    X = graph.get_tensor_by_name("X:0")
    yhat = graph.get_tensor_by_name("tanh:0")
    print('Successfully load the pre-trained model!')
- 通过 saver.restore 我们可以得到预训练的所有参数值,然后再通过 graph.get_tensor_by_name 得到模型的输入张量和我们想要的输出张量。
3. 运行前向传播过程得到预测值
def predict(txtdata):
    """
        Convert data to Numpy array which has a shape of (-1, 41, 41, 41 3).
        Test a single example.
        Arg:
                txtdata: Array in C.
        Returns:
            Three coordinates of a face normal.
    """
    global X, yhat

    data = np.array(txtdata)
    data = data.reshape(-1, 41, 41, 41, 3)
    output = sess.run(yhat, feed_dict={X: data})  # (-1, 3)
    output = output.reshape(-1, 1)
    ret = output.tolist()
    return ret
- 通过 feed_dict 喂入测试数据,然后 run 输出的张量我们就可以得到预测值。
4. 测试
load_model()
testdata = np.fromfile('/home/senius/python/c_python/test/04t30t00.npy', dtype=np.float32)
testdata = testdata.reshape(-1, 41, 41, 41, 3) # (150, 41, 41, 41, 3)
testdata = testdata[0:2, ...] # the first two examples
txtdata = testdata.tolist()
output = predict(txtdata)
print(output)
#  [[-0.13345889747142792], [0.5858198404312134], [-0.7211828231811523],
# [-0.03778800368309021], [0.9978875517845154], [0.06522832065820694]]
- 本例输入是一个三维网格模型处理后的 [41, 41, 41, 3] 的数据,输出一个表面法向量坐标 (x, y, z)。
获取更多精彩,请关注「seniusen」!