转自http://www.billauer.co.il/peakdet.html
peakdet: Peak detection using MATLAB
peakdet:使用MATLAB的峰值检测
Here's a problem I encounter in several fields: Find the local maxima and minima in some noisy signal, which typically looks like the following graph:
在几个领域,我遇到一个问题:在一些噪声信号中找到区间的最大值和最小值,它通常看起来像下面的图:
The local maxima and minima are plotted as red and green stars on the graph. To the eye it's so obvious where they are, but making a computer find them can turn out tricky.
该区间的最大值和最小值被绘制成图上的红色和绿色的星星。用眼睛很明显的发现他们在哪里,但是用电脑编程发现他们是棘手的。
Let's start with what not to do: Using the well-known zero-derivate method. Due to the noise, which is always there in real-life signals, accidental zero-crossings of the first derivate occur, yielding false detections. The typical solution is to smooth the curve with some low-pass filter, usually killing the original signal at the same time. The result is usually that the algorithm goes horribly wrong where it's so obvious to the eye.
让我们这样开始:使用著名的零导数的方法。由于噪声,它总是在现实生活中的信号的过零点,偶然的一阶导数时,产生错误检测。典型的解决方案是光滑的曲线具有一定的低通滤波器,通常造成原始信号的同时。结果通常是,算法错的离谱,眼睛看到的确实那么明显。
In many cases, we don't really care about maxima and minima in the mathematical sense. We can see the peaks and valleys, and we want the computer to find them. This is what "peakdet" does.
在许多情况下,我们真的不在乎的最大值和最小值的数学意义。我们可以看到山峰和山谷,我们想让电脑找到他们。这就是“peakdet”。
The trick here is to realize, that a peak is the highest point betweem "valleys". What makes a peak is the fact that there are lower points around it. This strategy is adopted by "peakdet": Look for the highest point, around which there are points lower by X on both sides.
找到峰的技巧是这样,一个峰是谷之间的最高点。峰是点,在该点的周围有较它低的点。这种策略是由“peakdet”采用:寻找最高点,在x轴上,该点两边的点的y值都小于该点的y值。
Let's see an example: First, let's create the graph shown in the figure above:
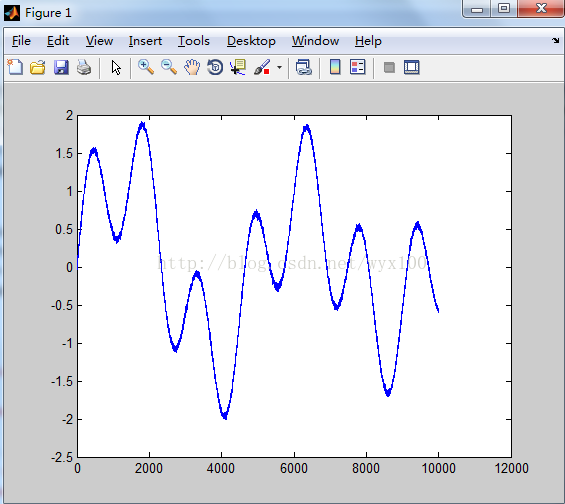
例如:首先,让我们创建上图中所示的图:
>>t=0:0.001:10;
>>x=0.3*sin(t) + sin(1.3*t) + 0.9*sin(4.2*t) + 0.02*randn(1, 10001);
>>figure; plot(x);
 t=0:0.001:10;
 x=0.3*sin(t) + sin(1.3*t) + 0.9*sin(4.2*t) + 0.02*randn(1, 10001);
 figure; plot(x);
>> [maxtab, mintab] = peakdet(x, 0.5);
>> hold on; plot(mintab(:,1), mintab(:,2), 'g*');
>> plot(maxtab(:,1), maxtab(:,2), 'r*');
[maxtab, mintab] = peakdet(x, 0.5);
hold on; plot(mintab(:,1), mintab(:,2), 'g*');
plot(maxtab(:,1), maxtab(:,2), 'r*');
Note the call to peakdet(): The first argument is the vector to examine, and the second is the peak threshold: We require a difference of at least 0.5 between a peak and its surrounding in order to declare it as a peak. Same goes with valleys.
注意调用peakdet():第一个参数是待检测的向量,第二个是阈值:我们需要至少0.5的阀值,在峰和它其周围以宣布它作为一个峰值之间的差。谷同理。
The returned vectors "maxtab" and "mintab" contain the peak and valley points, as evident by their plots (note the colors).
返回向量”maxtab”和“Mintab”包含峰谷点,明显的情节(注意颜色)。
The vector's X-axis values can be passed as a third argument (thanks to Sven Billiet for his contribution on this), in which case peakdet() returns these values instead of indices, as shown in the following example:
向量的x轴的坐标值可以作为第三个参数传递(感谢Sven Billiet的贡献在这),在这种情况下返回这些值代替peakdet()指标,如下面的示例所示:
>> figure; plot(t,x);
>> [maxtab, mintab] = peakdet(x, 0.5, t);
figure; plot(t,x);
[maxtab, mintab] = peakdet(x, 0.5, t);
And from here we continue like before, but note that the X axis represents "t" and not indices.
从这里我们继续像以前一样,但请注意,X轴代表“t”而不是指数。
>> hold on; plot(mintab(:,1), mintab(:,2), 'g*');
>> plot(maxtab(:,1), maxtab(:,2), 'r*');
hold on; plot(mintab(:,1), mintab(:,2), 'g*');
plot(maxtab(:,1), maxtab(:,2), 'r*');
%合并后
t=0:0.001:10;
x=0.3*sin(t) + sin(1.3*t) + 0.9*sin(4.2*t) + 0.02*randn(1, 10001);
figure;
plot(x); [maxtab, mintab] = peakdet(x, 0.5);
hold on;
plot(mintab(:,1), mintab(:,2), 'g*');
plot(maxtab(:,1), maxtab(:,2), 'r*');
为实现此项功能:工作完成一个循环,这被认为是在MATLAB的糟糕的实践。因为我从来都不需要这种功能的任何其他比很短向量(<100000分),我也从来没有试着加快速度。编写Mex是一个直接的解决方案。我不确定它是否可以量化,该算法在MATLAB。我很乐意听的建议。
A final note: If you happen to prefer Python, you could try this (someone has been kind enough to convert this function). There are also aversion in C by Hong Xu and aversion in FORTRAN 90 by Brian McNoldy. I haven't verified any of these.
最后一点:如果你碰巧喜欢Python,你可以试一下这个(有人已经足够将这个功能)。也有C版本(Hong Xu)和FORTRAN 90(Brian McNoldy)。我还没有证实任何这些。
And here is the function. Copy and save it as 'peakdet.m'. It's released to the public domain:
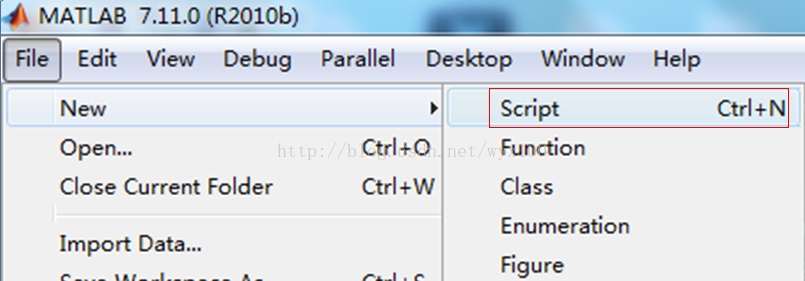
函数matlab代码如下。复制并保存为“peakdet.m”。
注意:使用matlab 中的file-new-script 建立m文件,否则会出现乱码,不能正常执行。
function [maxtab, mintab]=peakdet(v, delta, x)
%PEAKDET Detect peaks in a vector
%        [MAXTAB, MINTAB] = PEAKDET(V, DELTA) finds the local
%        maxima and minima ("peaks") in the vector V.
%        MAXTAB and MINTAB consists of two columns. Column 1
%        contains indices in V, and column 2 the found values.
%
%        With [MAXTAB, MINTAB] = PEAKDET(V, DELTA, X) the indices
%        in MAXTAB and MINTAB are replaced with the corresponding
%        X-values.
%
%        A point is considered a maximum peak if it has the maximal
%        value, and was preceded (to the left) by a value lower by
%        DELTA.

% Eli Billauer, 3.4.05 (Explicitly not copyrighted).
% This function is released to the public domain; Any use is allowed.

maxtab = [];
mintab = [];

v = v(:); % Just in case this wasn't a proper vector

if nargin < 3
  x = (1:length(v))';
else
  x = x(:);
  if length(v)~= length(x)
    error('Input vectors v and x must have same length');
  end
end

if (length(delta(:)))>1
  error('Input argument DELTA must be a scalar');
end

if delta <= 0
  error('Input argument DELTA must be positive');
end

mn = Inf; mx = -Inf;
mnpos = NaN; mxpos = NaN;

lookformax = 1;

for i=1:length(v)
  this = v(i);
  if this > mx, mx = this; mxpos = x(i); end
  if this < mn, mn = this; mnpos = x(i); end

  if lookformax
    if this < mx-delta
      maxtab = [maxtab ; mxpos mx];
      mn = this; mnpos = x(i);
      lookformax = 0;
    end
  else
    if this > mn+delta
      mintab = [mintab ; mnpos mn];
      mx = this; mxpos = x(i);
      lookformax = 1;
    end
  end
end
function [maxtab, mintab]=peakdet(v, delta, x) 函数功能介绍
function [maxtab, mintab]=peakdet(v, delta, x)
%v,x轴顺序取值(1、2、...10001)时,对应的y轴的值
%delta 差值 △X的意思
%x,x轴顺序取值(1、2、...10001)
%maxtab 二维数组,类似于坐标图上的点坐标集合,每个点point(x,y)表示,它有n个point组成
%maxtab 第一列:顺序存放点的x坐标值,第二列:顺序存放与x轴点对应的的y坐标值,
%maxtab 每一行存放一个坐标点point(x,y)
%PEAKDET Detect peaks in a vector
%        [MAXTAB, MINTAB] = PEAKDET(V, DELTA) finds the local
%        maxima and minima ("peaks") in the vector V.
%        MAXTAB and MINTAB consists of two columns. Column 1
%        contains indices in V, and column 2 the found values.
%
%        With [MAXTAB, MINTAB] = PEAKDET(V, DELTA, X) the indices
%        in MAXTAB and MINTAB are replaced with the corresponding
%        X-values.
%
%        A point is considered a maximum peak if it has the maximal
%        value, and was preceded (to the left) by a value lower by
%        DELTA.

% Eli Billauer, 3.4.05 (Explicitly not copyrighted).
% This function is released to the public domain; Any use is allowed.

maxtab = [];%存放峰点坐标
mintab = [];%存放谷点坐标

v = v(:); % Just in case this wasn't a proper vector

if nargin < 3 %nargin:输入变量的个数
  x = (1:length(v))'; %1到10001
else
  x = x(:);
  if length(v)~= length(x) %~= 不等于
    error('Input vectors v and x must have same length');
  end
end

if (length(delta(:)))>1 %输入delta只能是一个值  并且大于等于0
  error('Input argument DELTA must be a scalar'); %scalar 标量
end

if delta <= 0
  error('Input argument DELTA must be positive');
end

mn = Inf; mx = -Inf;  %inf 当算出的结果大于某个数(这个数很大,
                      %比如10的很多次方),则MATLAB认为就是无穷大了,并返回 inf
mnpos = NaN; mxpos = NaN; % NaN:Not  a  Number 类似初始化赋值

lookformax = 1; %取峰和谷的标记  1:取峰,0取谷

for i=1:length(v) %length(v) v中值的个数 10001个
  this = v(i);%v(i)代表第i个点y轴值
  if this > mx, mx = this; mxpos = x(i); end %x(i)代表第i个点x轴值
  if this < mn, mn = this; mnpos = x(i); end

  if lookformax
    if this < mx-delta %y轴值的比较  满足该条件的点在峰的右边
      maxtab = [maxtab ; mxpos mx]; %给maxtab(二维向量)赋值,x轴值mxpos,y轴值mx
      mn = this; mnpos = x(i);
      lookformax = 0; %已取到峰,下一次取谷
    end
  else
    if this > mn+delta %y轴值的比较  满足该条件的点在谷的右边
      mintab = [mintab ; mnpos mn];
      mx = this; mxpos = x(i);
      lookformax = 1; %已取到谷,下一次取峰
    end
  end
end
[转]https://blog.csdn.net/wyx100/article/details/43083921
http://www.billauer.co.il/peakdet.html
https://github.com/xuphys/peakdetect/blob/master/peakdetect.c
http://terpconnect.umd.edu/~toh/spectrum/ipeak.html
https://terpconnect.umd.edu/~toh/spectrum/Introduction.html