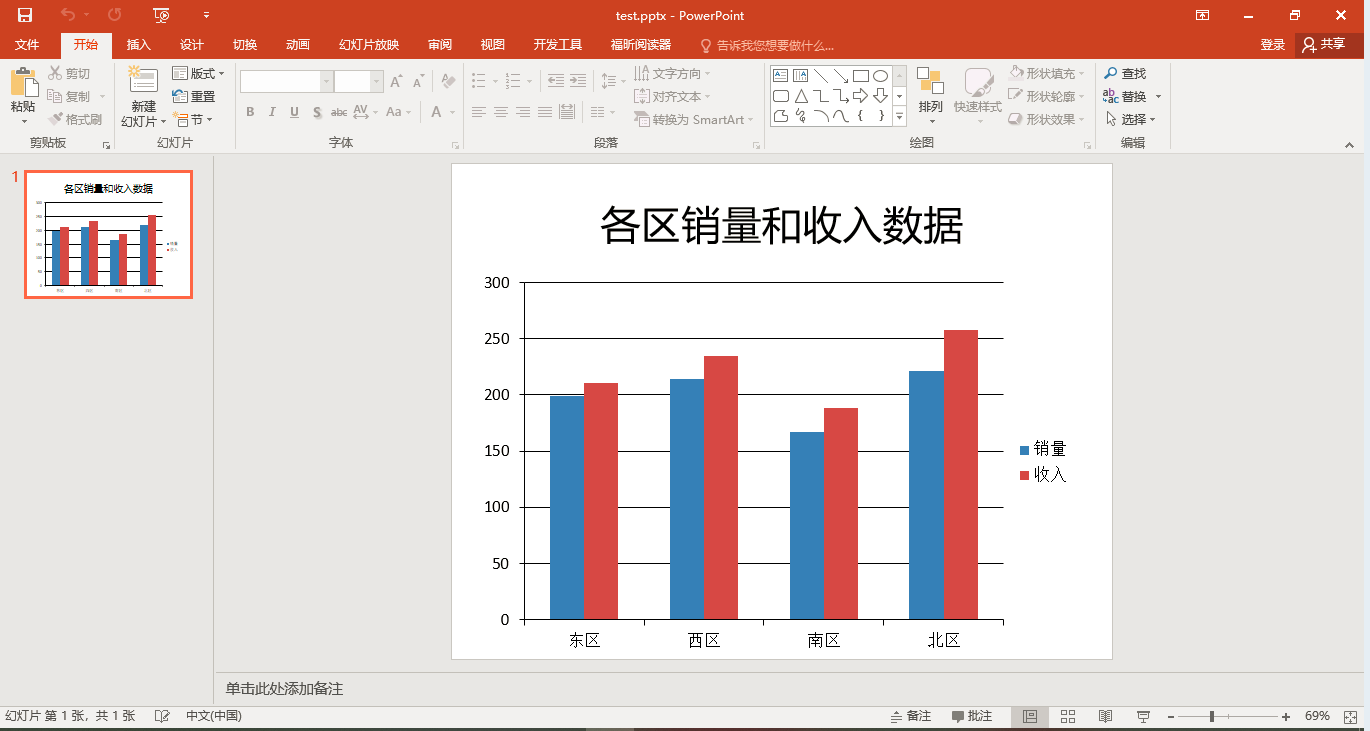
1、显示图例的簇状柱形图
# import
import os
from pptx import Presentation
from pptx.util import Cm
from pptx.chart.data import ChartData
from pptx.enum.chart import XL_CHART_TYPE, XL_LEGEND_POSITION

# 设置路径
work_path = r'E:pyspace	mppptx'
os.chdir(work_path)

# 创建幻灯片  -------------------------------------------------
prs = Presentation()    # 初始化 ppt 文档
title_only_slide = prs.slide_layouts[5]
slide = prs.slides.add_slide(title_only_slide)    # 添加幻灯片
shapes = slide.shapes
shapes.title.text = '各区销量和收入数据'

# 定义图表数据 -------------------------------------------------
chart_data = ChartData()    # 初始化
chart_data.categories = ['东区', '西区', '南区', '北区']
chart_data.add_series('销量', (199, 214, 167, 221))
chart_data.add_series('收入', (211, 235, 188, 258))

# 将图表添加到幻灯片 -------------------------------------------------
left, top, width, height = Cm(1), Cm(4), Cm(23), Cm(15)
graphic_frame = shapes.add_chart(chart_type=XL_CHART_TYPE.COLUMN_CLUSTERED,    # 图表类型为簇状柱形图
                                 x=left, y=top,    # 图表区左上角在幻灯片中的坐标位置
                                 cx=width,  cy=height,     # 图表区的长和宽
                                 chart_data=chart_data    # 图表数据
                                )

# 添加图例 -------------------------------------------------
chart= graphic_frame.chart
chart.has_legend = True    # 显示图例
chart.legend.position = XL_LEGEND_POSITION.RIGHT    # 图例显示位置
chart.legend.include_in_layout = False    # 图例在绘图区之外显示

# 保存 ppt 文档
prs.save('test.pptx')
效果: