zoukankan      html  css  js  c++  java
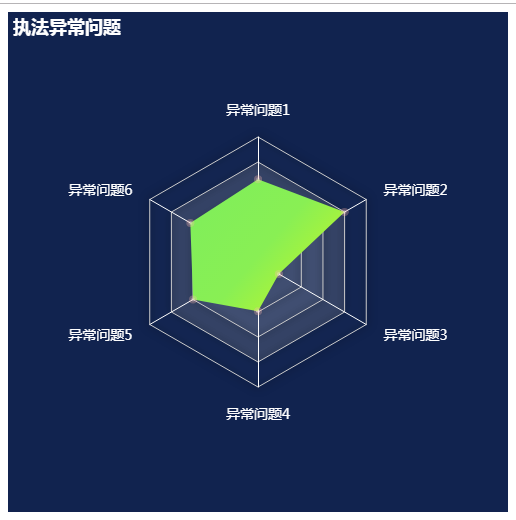
  • Echarts雷达图 实例

    <!DOCTYPE html>
    <html lang="en">
    
    <head>
        <meta charset="UTF-8">
        <meta name="viewport" content="width=device-width, initial-scale=1.0">
        <title>Document</title>
        <script src="/echarts.min.js"></script>
    </head>
    
    <body>
        <div id="a" style=" 500px; height: 500px; background-color: #11234F;"></div>
    
    </body>
    <script>
        var myChart = echarts.init(document.getElementById('a'))
        option = {
            title: {
                text: "执法异常问题",
                textStyle:{
                    color:'#fff'
                }
            },
            tooltip: {},
           
            radar: [{
                //这是雷达图的大小
                radius:'50%',
                //图外名称
                name:{
                    formatter:'{value}',
                    // 字体样式
                    textStyle:{
                        fontSize:14,
                        color:'#fff'
                    }
                },
                indicator: [{
                    name: "异常问题1",
                    max: 6500
                }, {
                    name: "异常问题6",
                    max: 16000
                }, {
                    name: "异常问题5",
                    max: 30000
                }, {
                    name: "异常问题4",
                    max: 38000
                }, {
                    name: "异常问题3",
                    max: 52000
                }, {
                    name: "异常问题2",
                    max: 25000
                }],
                //文字与图的距离
                nameGap: 20,
                //坐标轴线的设置
                axisLine: {
                    show: true,
                    lineStyle:{
                        color:'#FFF',
    
                    },
                    
                },
                //指示器轴的分割段数
                splitNumber: 5,
                axisTick: {
                    color:'#365079',
                    
                },
                axisLabel: {},
                splitLine: {
                    lineStyle: {
                        shadowBlur: 15,
                        shadowColor: null
                    }
                },
                //分割区域是否显示
                splitArea: {
                    //分割区域的样式
                    areaStyle:{
                        color: ['#fff', '#fff', '#fff', '#c3c3c3','#1F345E'],
                        shadowColor: 'rgba(0, 100, 0, 0.3)',
                        opacity: 0.2,
                    }
                }
            }],
            series: [{
                name: "执法异常问题",
                type: "radar",
                data: [{
                    value: [4300, 10000, 18000, 15000, 10000, 19990],
                    name: "执法异常问题",
                    itemStyle: { // 单个拐点标志的样式设置。
                    normal: {
                        borderColor: '#FFB9B0',
                        // 拐点的描边颜色。[ default: '#000' ]
                        borderWidth: 4,
                        // 拐点的描边宽度,默认不描边。[ default: 0 ]
                    }
                },
                lineStyle: { // 单项线条样式。
                    normal: {
                        opacity: 0.5 // 图形透明度
                    }
                },
                areaStyle: { // 单项区域填充样式
                    normal: {
                        // color: 'red', // 填充的颜色。[ default: "#000" ]
                        //不透明
                        opacity:1,
                        //数据阴影
                        shadowColor:'#2c3F56',
                        // 阴影长度
                        shadowBlur:3,
                        // 阴影偏移
                        shadowOffsetY:2,
                        shadowoffsetX:5,
                        //填充区域颜色渐变
                        color: new echarts.graphic.LinearGradient(
                        0, 0, 1, 1,
                        [
                            // 柱子0%的颜色
                            {offset: 0, color: '#7EEE5c'},
                            //柱子50%的颜色
                            {offset: 0.5, color: '#89EF54'},
                            //柱子100%的颜色
                            {offset: 1, color: '#CFF91E'}
                        ]
                    )
                    }
                }
                 }],
                itemStyle: { // 折线拐点标志的样式。
                    normal: { // 普通状态时的样式
                        lineStyle: {
                            0
                        },
                        opacity: 0.3
                    },
                    emphasis: { // 高亮时的样式
                    lineStyle: {
                    },
                    opacity: 1
                }
                },
            }]
        }
    myChart.setOption(option)
    
    </script>
    
    </html>
  • 相关阅读:
    OutputCache 缓存key的创建 CreateOutputCachedItemKey
    Asp.net Web Api源码调试
    asp.net mvc源码分析DefaultModelBinder 自定义的普通数据类型的绑定和验证
    Asp.net web Api源码分析HttpParameterBinding
    Asp.net web Api源码分析HttpRequestMessage的创建
    asp.net mvc源码分析ActionResult篇 RazorView.RenderView
    Asp.Net MVC 项目预编译 View
    Asp.net Web.config文件读取路径你真的清楚吗?
    asp.net 动态创建TextBox控件 如何加载状态信息
    asp.net mvc源码分析BeginForm方法 和ClientValidationEnabled 属性
  • 原文地址:https://www.cnblogs.com/sheep-fu/p/13575488.html
Copyright © 2011-2022 走看看