安装graphviz
可去官网下载http://www.graphviz.org/download/下载之后按步骤安装
打开编辑器,创建*.dot文件,编辑dot脚本代码,保存。
D:>dot -Tpng *.dot -o *.png
D:>*.png
-T的意思是生成的文件是png格式的,*.dot是代码所在的文件,-o是指定生成的文件名
dot脚本语言笔记
声明无向图
graph a {/*******/}
声明有向图
digraph a {/*******/}
声明子图
subgraph cluster_son{
    //子图的名字必须以cluster开始
    /******/
}
图的基本属性
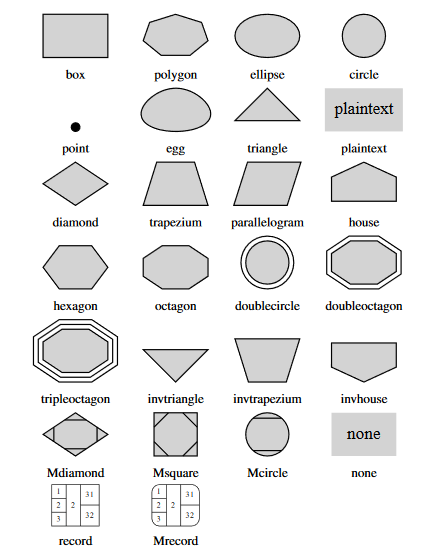
label/*标签,设置图或者结点的描述信息*/
shape/*设置结点形状*/{box/*长方形*/ polygon/*多边形*/circle/*圆形*/elipse/*椭圆,默认*//*等*/}
bgcolor/*设置图的背景颜色,可以颜色的英文形式或者"#AABBC"*/
rankdir/*设置图的方向*/{TB(top to bottom)、BT(bottom to top)、LR(left to right)、RL(right to left)}
rotate/*设置图的旋转*/ rotate=90 /*逆时针旋转90度*/
size="_,_"/*设置图的大小*/
style /*设置结点的样式*/{filled/*填充*/、dotted/*点状边框*/、solid/*普通边框*/、dashed/*虚线边框*/、bold/*边框加粗*/、invis/*隐形*/}
color/*设置边框颜色,用法同bgcolor*/
fillcolor/*设置填充颜色,仅对style=filled有效*/
height weight/*设置结点的高度和宽度*/
fontcolor/*设置结点内容颜色,用法同上*/
peripheries/*设置结点边框个数*/
graph a {a[label="sun",shape=circle,style=filled,fillcolor=red,color=yellow,peripheries=8,fontcolor=blue];}
边的基本属性
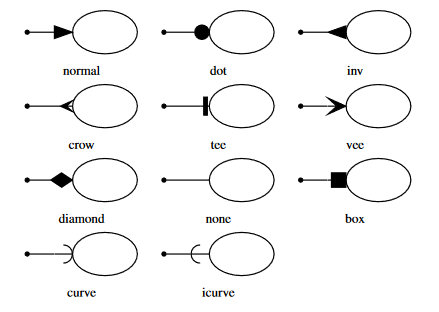
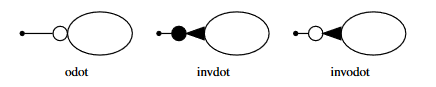
style/*设置边的格式*/{solid/*实线*/、dashed/*虚线*/、dotted/*点状线*/、bold/*加粗*/、invis/*隐形*/}
label/*设置边标签,可以使用转义字符*/
color/*设置边的颜色*/
arrowhead/*设置箭头的样式*/{normal,dot,inv,crow,tee,vee,none..}
digraph a {
    //设置全局变量
    node[shape=circle,style=filled,fillcolor=red,color=yellow,peripheries=2,fontcolor=blue];
    edge[style=bold,color=red,arrowhead=curve];
    a -> b;
}
label的简单应用
digraph G {
    node[shape=record];
    struct1[shape=record,label="<f0> left|<f1> mid|<f2> right"];
    struct2[shape=record,label="<f0> one|<f1> two"];
    struct3[shape=record,label="hello
world|{b|{c|<here>d|e}|f}|g|h"];
    struct1->struct2;
    struct1->struct3;
}
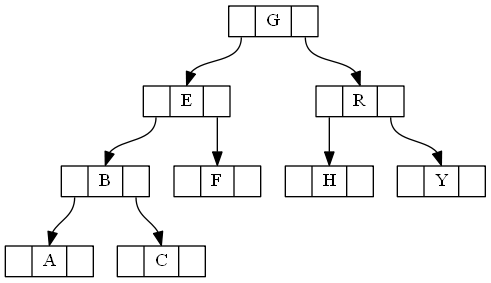
结构数据record的应用
digraph g{
    node[shape=record,height=.1];
    node0[label="<f0> |<f1> G|<f2> "];
    node1[label="<f0> |<f1> E|<f2> "];
    node2[label="<f0> |<f1> B|<f2> "];
    node3[label="<f0> |<f1> F|<f2> "];
    node4[label="<f0> |<f1> R|<f2> "];
    node5[label="<f0> |<f1> H|<f2> "];
    node6[label="<f0> |<f1> Y|<f2> "];
    node7[label="<f0> |<f1> A|<f2> "];
    node8[label="<f0> |<f1> C|<f2> "];
    "node0":f2->"node4":f1;
    "node0":f0->"node1":f1;
    "node1":f0->"node2":f1;
    "node1":f2->"node3":f1;
    "node2":f2->"node8":f1;
    "node2":f0->"node7":f1;
    "node4":f2->"node6":f1;
    "node4":f0->"node5":f1;
}
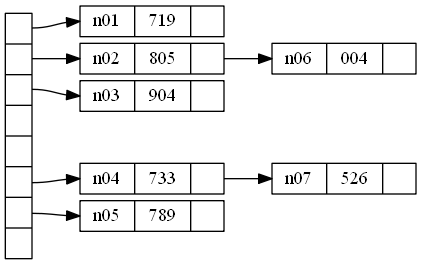
record建哈希表
digraph g{
    nodesep=.05;
    rankdir=LR;
    node[shape=record,width=.1,height=.1];
    node0[label="<f0>|<f1>|<f2>|<f3>|<f4>|<f5>|<f6>|<f7>",height=2.5];
    node[width=1.5];
    node1[label="{<f0> n01|719|<f2>}"];
    node2[label="{<f0> n02|805|<f2>}"];
    node3[label="{<f0> n03|904|<f2>}"];
    node4[label="{<f0> n04|733|<f2>}"];
    node5[label="{<f0> n05|789|<f2>}"];
    node6[label="{<f0> n06|004|<f2>}"];
    node7[label="{<f0> n07|526|<f2>}"];
    node0:f0->node1:f0;
    node0:f1->node2:f0;
    node0:f2->node3:f0;
    node0:f5->node4:f0;
    node0:f6->node5:f0;
    node2:f2->node6:f0;
    node4:f2->node7:f0;
}
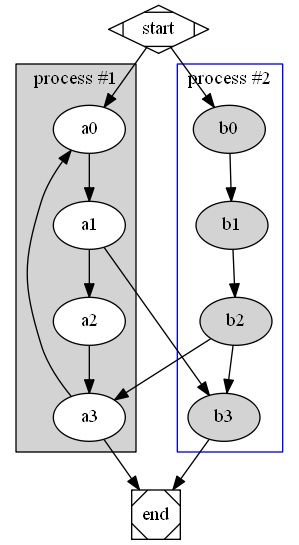
subgraph cluster的简单应用
digraph G{
    subgraph cluster0{
        node[style=filled,fillcolor=white];
        style=filled;
        fillcolor=lightgrey;
        a0->a1->a2->a3;
        label="process #1";
    }
    subgraph cluster1{
        node[style=filled];
        b0->b1->b2->b3;
        label="process #2";
        color=blue;
    }
    start->a0;
    start->b0;
    a1->b3;
    b2->a3;
    a3->a0;
    a3->end;
    b3->end;
    start[shape=Mdiamond];
    end[shape=Msquare];
}
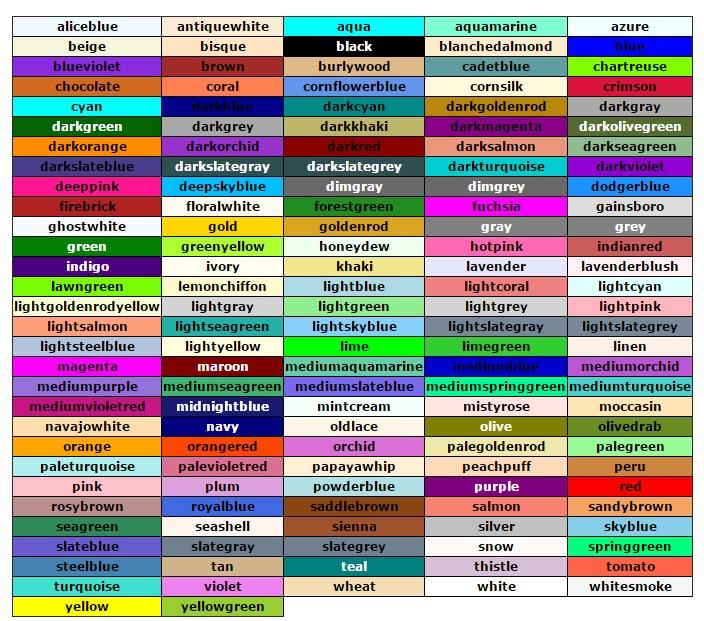
graphviz支持的颜色
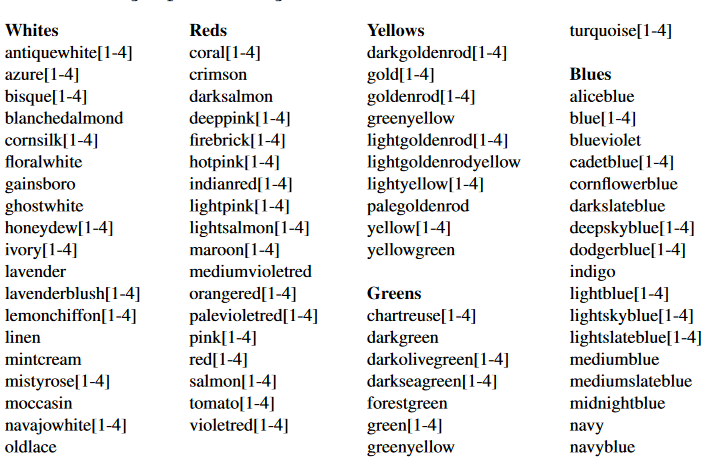
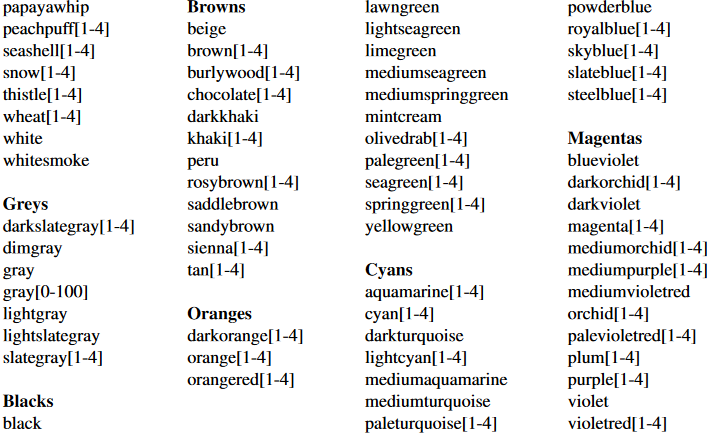
常用颜色
graphviz dot 应用
dir关系:设置每条边箭头的方向,用dir有(forward(default),back,both,none)4种
digraph g{
    a->b[dir=both];
    b->c[dir=none];
    c->d[dir=back];
    d->a[dir=forward];
}
连接点的方向:用"n","ne","e","se","sw","w","nw"分别表示冲哪一个方向连接这个结点
digraph g{
    //a->[tailport=se];
    a->b:nw;
}
子图,点,线的位置:
默认时图中的线都是从上到下的,即TB(top->bottom),可以改为从左至右,在文件的最上层输入rankdir=LR;
当图中时间表之类的东西时,会需要点能排在一行(列),用花括号把rank=same,然后把需要并排的点一次输入。
digraph g{
    rankdir=LR;
    {
        node[shape=plaintext];
        2011->2012->2013;
    }
    {
        node[shape=box,style=filled];
        M1->M2->M3;
        M1->M1s;
        M2->M2s->M2A;
    }
    {
        {rank=same;2011;M1;}
        {rank=same;2012;M1s;M2;}
        {rank=same;2013;M2s;M2A;M3;}
    }

}
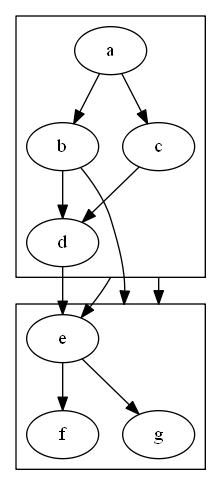
子图,点线的位置:
先输入compound=true,然后用lhead和ltail来设置连接的子图
digraph g{
    compound=true;
    subgraph cluster0{
        a->{b,c}
        b->d;
        c->d;
    }
    subgraph cluster1{
        e->{g,f}
    }
    b->f[lhead=cluster1];
    d->e;
    c->g[ltail=cluster0,lhead=cluster1];
    c->e[ltail=cluster0];
}
想了解更多,请参考官方文档