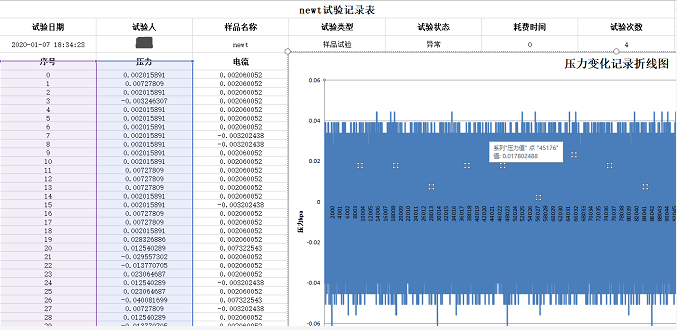
一、如图
- 30万数据,比较大,挤一起了
import sys
import uuid
import string
import json
import time
import random
import os
import base64

from openpyxl.workbook import Workbook
from openpyxl.styles import Font, Alignment, Side, Border
from openpyxl.drawing import image
from openpyxl.chart import Series,LineChart, Reference
from openpyxl.chart.axis import DateAxis

# path = os.path.dirname(os.path.dirname(__file__))
# sys.path.insert(0,path)
from Lib.Utils import Utils

class ExportReport:

    def __init__(self,entity, recordList,**kwargs):
        """

        :param entity: 记录对象
        :param recordList: 记录["压力","电流"]列表
        :param kwargs:
        """
        self.entity = entity
        self.record_list = recordList
        self.image_path = kwargs.get('imgPath', None)  #图片路径
        # self.all_stage = ["未开始","清洗","配气","搅拌","点火","完成"]
        self.status_all = ["未完成", "成功", "<2070kpa"]
        self.data_head = ["start_time","experiment_user_name","material_name", "experiment_type","is_success", "time_cost","test_count"]
        self.base_info_list = ["试验日期","试验人", "样品名称", "试验类型", "试验状态", "耗费时间","试验次数"]
        # self.data_col = ["start_time","test_count","rcd_stage","set_concentration","real_concentration","burning_speed"]
        # self.col_list = ["试验时间", "试验次数", "试验阶段", "设定浓度%", "实际浓度%", "燃烧速度"]
        # self.all_col = len(self.col_list)  # 一共多少列
        # base64转化为图片
        # self.bs64 = bs64
        # self.img_path = Utils.change_base64_as_img(self.bs64)
        self.wb = Workbook()
        #self.wb.remove(self.wb["sheet"])

        self.ws = self.wb.create_sheet("{0}试验记录表".format(self.entity.material_name), 0)
        #生成头部所含列总数的大写字母
        self.header_upper_string_list = string.ascii_uppercase[:len(self.base_info_list)]
        #生成所含列总数的大写字母
        # self.upper_string_list = string.ascii_uppercase[:self.all_col]
        # 水平对齐,居中对齐
        self.alignment_style = Alignment(horizontal='center', vertical='center')
        #定义border 边框样式
        left, right, top, bottom = [Side(style='thin', color='000000')]*4
        self.border_style = Border(left=left, right=right, top=top, bottom=bottom)
        #定义字体
        self.font_size = Font(size=9)
        for col in self.header_upper_string_list :
            self.ws.column_dimensions[col].width = 25

    #单元格样式字体调整
    def cell_set(self, cellObj, fontSzie=12, alignmentStyle=None):
        alignmentStyle = alignmentStyle if alignmentStyle else self.alignment_style
        cellObj.alignment = alignmentStyle
        cellObj.font = Font(size=fontSzie, bold=True)

    #单元格样式字体居中
    def cell_textalign_center(self,cellObj):
        cellObj.alignment = self.alignment_style

    #创建表头第一行
    def create_row1(self):
        #把1、2行所有列合并
        self.ws.merge_cells(start_row=1, end_row=2, start_column=1, end_column=self.base_info_list.__len__())
        #写入值
        # self.ws.cell(row=1, column=1).value = value
        self.ws.cell(row=1, column=1).value = "{0}试验记录表".format(self.entity.material_name)
        # self.ws['A1'].alignment = self.alignment_style
        # self.ws['A1'].font = Font(size=16, bold=True)
        self.cell_set(self.ws['A1'], 16)
        self.create_row3_4()
        self.create_row7_8()

    def create_row3_4(self):
        for col in range(1, len(self.base_info_list)+1):
            self.ws.merge_cells(start_row=3, end_row=4, start_column=col, end_column=col)
            col_str = self.header_upper_string_list[col-1]+"3"
            self.ws[col_str] = self.base_info_list[col-1]
            self.cell_set(self.ws[col_str])
        #合并 5 6 两行单元格
        for col in range(1, len(self.base_info_list)+1):
            self.ws.merge_cells(start_row=5, end_row=6, start_column=col, end_column=col)

    def create_row7_8(self):
        dataNum = ["序号", "压力", "电流"]
        for col in range(1, 4):
            self.ws.merge_cells(start_row=7, end_row=8, start_column=col, end_column=col)
            col_str = "ABCD"[col-1]+"7"
            self.ws[col_str] = dataNum[col-1]
            self.cell_set(self.ws[col_str])

    def timeStampToUTC8(self,timeStamp):
        return time.strftime("%Y/%m/%d %H:%M:%S",time.localtime(timeStamp/1000))


    def add_data(self):
        #第五行开始写入数据,所有数据居中对齐,水平居中
        # 字符为A/B,第五行
        for i,v in enumerate(self.data_head):
            cur_v = getattr(self.entity,v)
            if v == "experiment_type":
                cur_v = ["样品试验","参考品试验","时间/压力试验"][cur_v]
            if v == "is_success":
                cur_v = ["异常","计时","<2070kPa"][cur_v]
            self.ws[self.header_upper_string_list[i]+"5"] = cur_v
        for i in self.header_upper_string_list:
            col_str = i +"5"
            self.cell_textalign_center(self.ws[col_str])
        for idx, data in enumerate(self.record_list[0]):
            col_str = "A{}".format(9+idx)
            self.ws[col_str] = idx
            self.cell_textalign_center(self.ws[col_str])
            col_str = "B{}".format(9 + idx)
            self.ws[col_str] = data
            self.cell_textalign_center(self.ws[col_str])
            col_str = "C{}".format(9 + idx)
            self.ws[col_str] = self.record_list[1][idx]
            self.cell_textalign_center(self.ws[col_str])
        self.draw_line_chart()

    #画折线图
    def draw_line_chart(self):
        self.chart = LineChart()
        self.chart.title = "压力变化记录折线图"
        self.chart.style = 2
        self.chart.width = 36
        self.chart.height = 20
        self.chart.y_axis.title = "压力kpa"
        # self.chart.y_axis.crossAx = 500
        # self.chart.x_axis = DateAxis(crossAx=100)
        # self.chart.x_axis.number_format = '%H:%M:%S'
        # self.chart.x_axis.majorTimeUnit = "days"
        self.chart.x_axis.title = "序号"
        data1 = Reference(
            self.ws,
            min_col=2,
            min_row=8,
            max_col=2,
            max_row=len(self.record_list[0])+8
        )
        seriesObj1 = Series(data1, title='压力值')
        self.chart.append(seriesObj1)
        # self.chart.add_data(data, titles_from_data=True)
        dates = Reference(self.ws, min_col=1, min_row=8, max_row=len(self.record_list[0])+8)
        self.chart.set_categories(dates)
        self.ws.add_chart(self.chart, "D7")

    def draw_electric_cur(self):
        self.chart = LineChart()
        self.chart.title = "电流记录折线图"
        self.chart.style = 2
        self.chart.width = 36
        self.chart.height = 20
        self.chart.y_axis.title = "电流A"
        # self.chart.y_axis.crossAx = 500
        # self.chart.x_axis.crossAx = -5
        # self.chart.x_axis = DateAxis(crossAx=100)
        # self.chart.x_axis.number_format = '%H:%M:%S'
        # self.chart.x_axis.majorTimeUnit = "days"
        self.chart.x_axis.title = "序号"
        # self.chart.y_axis.scaling.min = self.min_diff-0.1
        # self.chart.y_axis.scaling.max = self.max_diff+0.1
        data3 = Reference(
            self.ws,
            min_col=3,
            min_row=8,
            max_col=3,
            max_row=len(self.record_list[1])+8
        )
        seriesObj3 = Series(data3, title='电流')
        self.chart.append(seriesObj3)
        dates = Reference(self.ws, min_col=1, min_row=8, max_row=len(self.record_list[1]) + 8)
        self.chart.set_categories(dates)
        self.ws.add_chart(self.chart, "D49")

    def create(self,value=None):
        if value:
            self.ws.cell(row=1, column=1).value = value
        self.create_row1()
        self.add_data()
        self.draw_line_chart()
        if self.entity.experiment_type!=2:
            self.draw_electric_cur()

    def save(self, filename):
        try:
            self.wb.save(filename)
        except Exception as e:
            print(e)
            self.wb.save(filename[:-5] + str('_' + Utils.getFileName()) + filename[-5:])
        # 关闭excel
        self.close()

    def close(self):
        self.wb.close()

class TestObj:

    def __init__(self):
        self.test_list = ["start_time","experiment_user_name","material_name", "experiment_type","is_success", "time_cost","test_count"]

if __name__ == '__main__':
    t = TestObj()
    for idx,para in enumerate(t.test_list):
        t.__setattr__(para,idx)
    record_list = [
        [random.randrange(i,i+10) for i in range(100)],
        [random.random() for j in range(150)]
    ]
    export = ExportReport(t,record_list)
    export.create()
    export.save("127.xlsx")