线性最小二乘法
1. 原理:
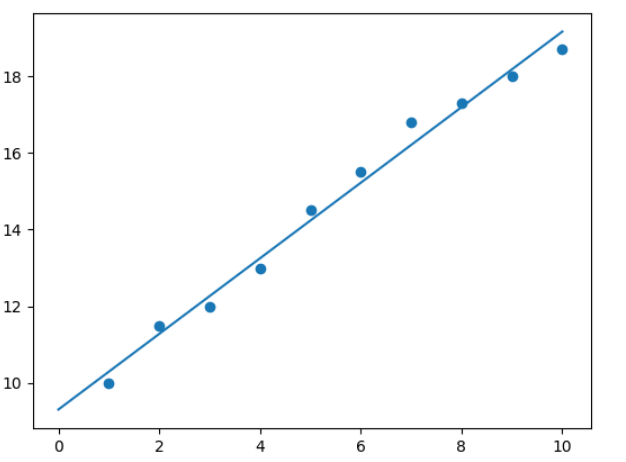
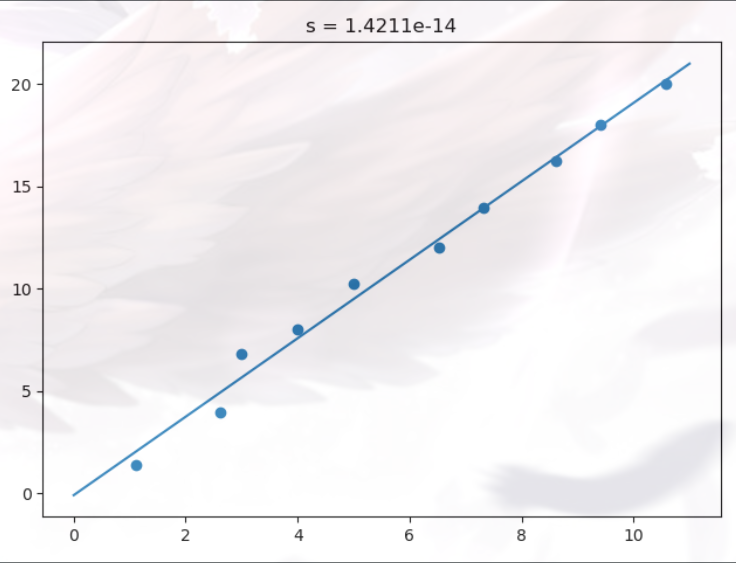
通过最小化误差的平方和寻找数据的最佳函数匹配,如图(点到直线距离最短)
2. 求解
假设直线为:
![]()
最小二乘模型:
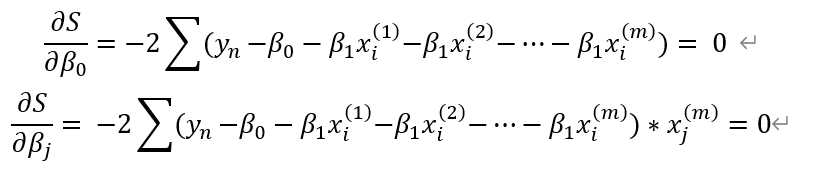
求解:
方程化:
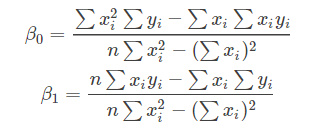
解得:
代码实现:
###最小二乘实现
import numpy as np
import matplotlib.pyplot as plt

def linear_least_squares(x, y):
    if not len(x) == len(y) :
        raise ValueError("横纵坐标数据个数不同")
    if len(x) == 1 or len(y) == 1:
        raise ValueError("传入坐标数为1")
    X, Y = np.array(x), np.array(y)
    XX, XY = X * X, X * Y
    sumX, sumY, sumXY, sumXX = sum(X), sum(Y), sum(XY), sum(XX)
    n = len(x)
    a = (sumXX*sumY - sumX*sumXY)/(n*sumXX - sumX**2)
    b = (n*sumXY - sumX*sumY)/(n*sumXX - sumX**2)
    s = n*a + b*sumX - sumY
    return a, b, s
x_data = [1.12,2.62,2.99,4,5,6.52,7.31,8.62, 9.41, 10.58]
y_data = [0.69*2, 1.99*2,3.41*2, 4*2, 5.12*2,6.01*2,6.98*2,8.11*2,9.01*2,10*2]
a, b, s = linear_least_squares(x_data, y_data)
print(s)
x = np.linspace(0,11)
y = x * b + a
plt.title('s = {0:.4f}e-14'.format(s*(10**14)))
plt.plot(x, y)
plt.scatter(x_data, y_data)
plt.show()
结果
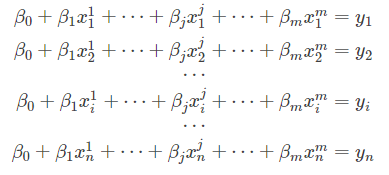
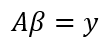
推广到一般形式
![]()
带入样本的得:
改为矩阵
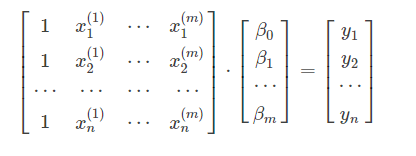
其中:
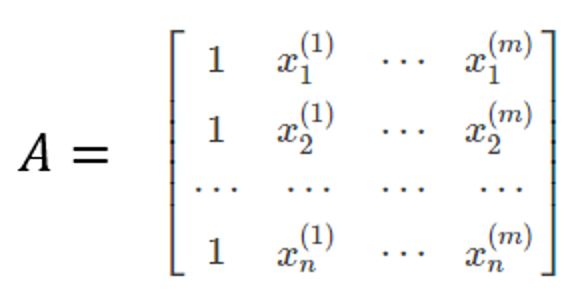
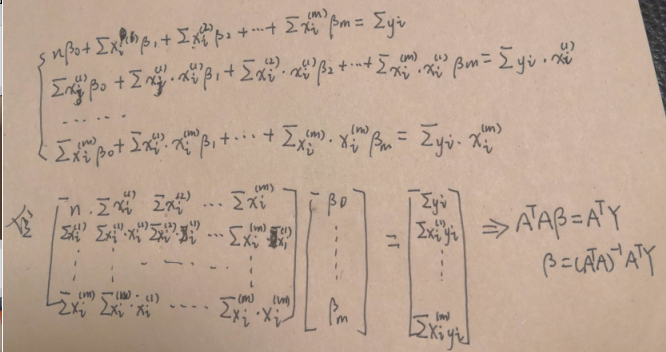
所以得到 :
求解:
![]()
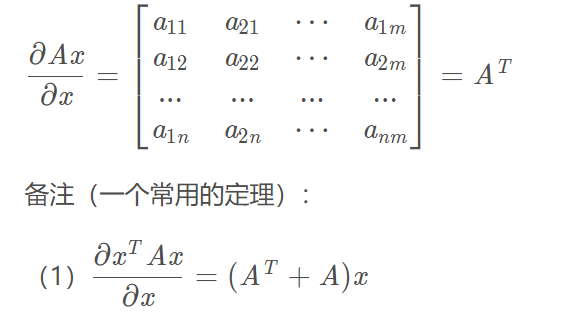
1.矩阵推导:
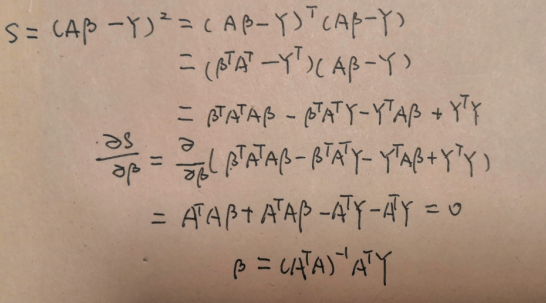
上述具体详见:https://zhuanlan.zhihu.com/p/24709748
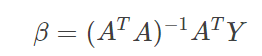
最优解:
注:
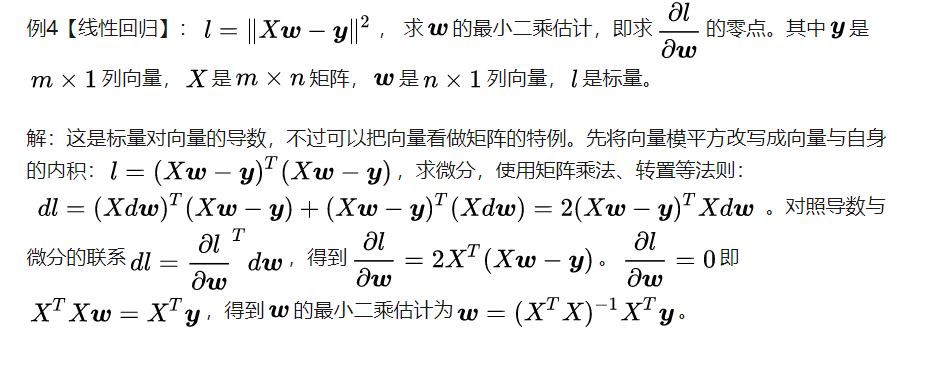
2.代数推导
代码实现:
import numpy as np
import pandas as pd
import matplotlib.pyplot as plt
def loadData(filename):
    fr = pd.read_excel(filename)
    data = np.mat(pd.concat([fr[0],fr[1],fr[2]], axis=1))
    label = np.mat(fr[3]).reshape(len(fr[3]),1)
    return data, label
def linea_least_squares(x,y):
    xTx = np.dot(x.T,x)
    rel = np.dot(xTx.I, x.T)
    rel = np.dot(rel, y)
    return rel.tolist()
x,y = loadData('C:/Users/shishenhao/Desktop/data.xlsx')
rel = linea_least_squares(x, y)
print(rel)
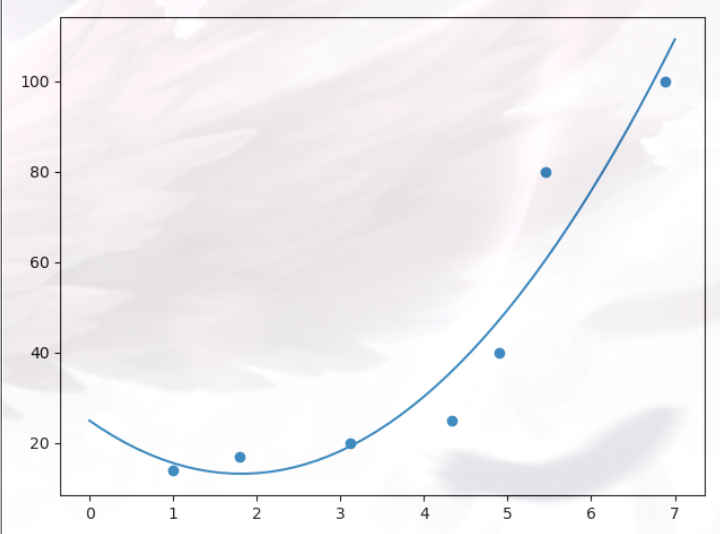
另:线性与非线性与所给数据有关,如下
import numpy as np
import pandas as pd
import matplotlib.pyplot as plt

def loadData(filename):
    fr = pd.read_excel(filename)
    data = np.mat(pd.concat([fr[0],fr[1],fr[2]], axis=1))
    label = np.mat(fr[3]).reshape(len(fr[3]),1)
    return data, label
def linea_least_squares(x,y):
    xTx = np.dot(x.T,x)
    rel = np.dot(xTx.I, x.T)
    rel = np.dot(rel, y)
    return rel.tolist()
x, y = loadData('C:/Users/shishenhao/Desktop/data.xlsx')
rel = linea_least_squares(x, y)
x1 = np.linspace(0, 7)
y1 = rel[0] + rel[1]*x1 + rel[2]*x1*x1
plt.plot(x1, y1)
plt.scatter(np.matrix.tolist(x[:,1]), np.matrix.tolist(y[:,0]))
plt.show()
直线和曲线的拟合与绘制(curve_fit()详解)
https://blog.csdn.net/guduruyu/article/details/70313176