1. plot指令的基本调用格式
(1)plot(x)
x为向量时,以该元素的下标为横坐标、元素值为纵坐标绘出曲线
x为实数二维数组时,则按列绘制每列元素值相对其下标的曲线,曲线数等于x数组的列数。
x为复数二维数组时,则按列分别以数组的实部和虚部为横、纵坐标绘制多条曲线
(2)plot(x, y)
x、y为同维数组时,绘制以x、y元素为横纵坐标的曲线
x为向量,y为二维数组、且其列数或行数等于x的元素数时,绘制多条不同颜色的曲线
x为二维数组,y为向量时,情况与上相同,只是y仍为纵坐标。
(3)plot(x1, y1, x2, y2, …)
绘制以x1为横坐标、y1为纵坐标的曲线1,以x2为横坐标、y2为纵坐标的曲线2,等等。
其中x为横坐标,y为纵坐标,绘制y=f(x)函数曲线。
例子:
clc,clear,close;
x = 0:pi/100:2*pi;
y = 2*exp(-0.5*x).*sin(2*pi*x);
plot(y)
subplot(1,3,1); plot(y); title('plot(x)');
subplot(1,3,2); plot(x,y); title('plot(x,y)');
subplot(1,3,3); plot(x,y,[0:7],(2*[0:7] + 1)/100); title('plot(x1,y1,x2,y2)');

2. hold on hold off 在同一张图中多次绘制
例子
t = 0:pi/100:pi;
y1 = sin(t)' * [1, 0];
y2 = sin(t).*sin(3*t).*sin(-3*t).*sin(-t);
plot(t,y1,'r-');
hold on
plot(t,y2,'b');
hold off

3. axis函数控制坐标轴
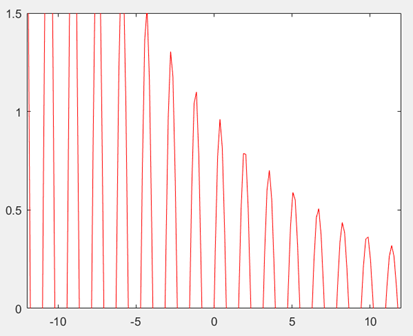
axis[a b c d] : 控制范围 a<=x<=b, c<=y<=d
例子
x = linspace(-15,15,200);
y = sin(4*x)./exp(.1*x);
plot(x,y,'-r')
axis([-12 12 0 1.5])
4. stem画散点图
x = [0:pi/20:2*pi]';
y = [cos(x).*sin(x), sin(x)];
stem(x,y)

5. stairs画阶梯图
x = [0:pi/20:2*pi]';
y = [cos(x).*sin(x), sin(x)];
hold on
stem(x,y);
stairs(x,y,'g');
hold off

6. plotyy指令画双纵坐标
x = 0:pi/100:2*pi;
y = 2*exp(-0.5*x).*sin(2*pi*x);
plotyy(x,y,[0:7],2*[0:7] + 1)

7. 制图辅助操作
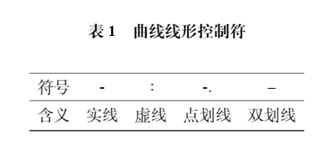

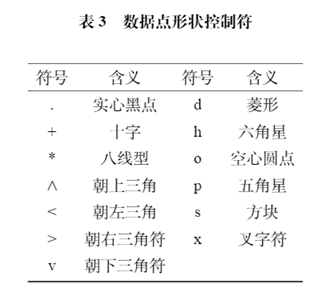
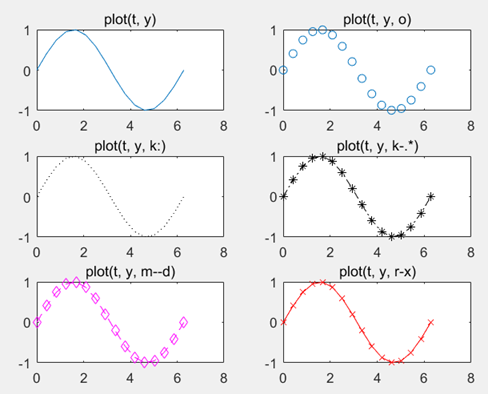
t=(0:15)*2*pi/15;
y=sin(t);
subplot(3,2,1), plot(t, y); title('plot(t, y)')
subplot(3,2,2), plot(t, y, 'o'); title('plot(t, y, o)')
subplot(3,2,3), plot(t, y, 'k:'); title('plot(t, y, k:)')
subplot(3,2,4), plot(t, y, 'k-.*'); title('plot(t, y, k-.*)')
subplot(3,2,5), plot(t, y, 'm--d'); title('plot(t, y, m--d)')
subplot(3,2,6), plot(t, y, 'r-x'); title('plot(t, y, r-x)')
8. 刻度、分格线和坐标框
grid on 画出分格线
grid off 不画分格线
box on 控制加边框线
box off 控制不加边框线
刻度设置
set(gca, ‘xtick’, xs, ‘ytick’, ys)
xs、ys可以使任何合法的实数向量,用于分别设置x、y轴的刻度。
例题:
t = 6*pi*(0:100)/100;
y=1-exp(-0.3*t).*cos(0.7*t);
plot(t,y,'r-');
grid on;
box on;
set(gca,'xtick',[pi,2.5*pi,4*pi],'ytick',[0.85,1,1.05,1.245]);

9. 图形标识
图名(title)
坐标轴名(xlabel、ylabel)
图形文本注释(text)
图例(legend)
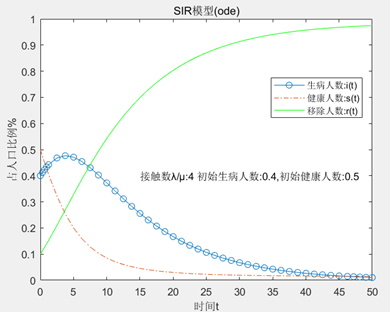
例(SIR,ode):
A = 0.4;
B = 0.1;
I = 0.4;
S = 0.5;
tspan = [0 50];
y0 = [I S];
[t, y] = ode45(@(t,y)odefun(t,y,A,B), tspan, y0);
r = 1-y(:,1)-y(:,2);
plot(t,y(:,1),'-o',t,y(:,2),'-.',t,r,'g');
hold on;
legend('生病人数:i(t)','健康人数:s(t)','移除人数:r(t)','Location','Best');
ylabel('占人口比例%');
xlabel('时间t');
str = ['接触数λ/μ:',num2str(A/B),' 初始生病人数:',num2str(I),',初始健康人数:',num2str(S)];
text(15,0.4,str,'FontSize',10);
title('SIR模型(ode)');
function dydt = odefun(t,y,A,B)
dydt = zeros(2,1);
dydt(1) = A*y(1)*y(2) - B*y(1);
dydt(2) = -A*y(1)*y(2);
end
10. 直方图 bar
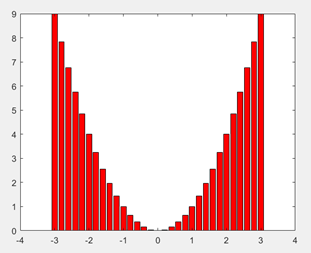
垂直直方图
x = -3:0.2:3;
bar(x,x.^2,'r')
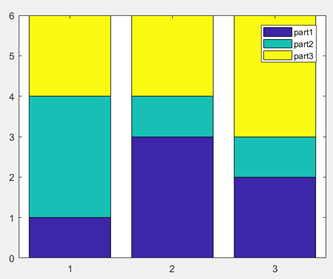
累计式
x=[1 2 3];
y=[1 3 2; 3 1 2; 2 1 3];
bar(x, y, 'stack');
legend('part1', 'part2', 'part3');
分组式
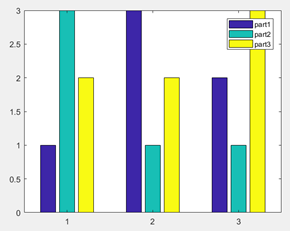
x=[1 2 3];
y=[1 3 2; 3 1 2; 2 1 3];
bar(x, y, 'group');
legend('part1', 'part2', 'part3');
水平直方图 barh
累计式
分组式
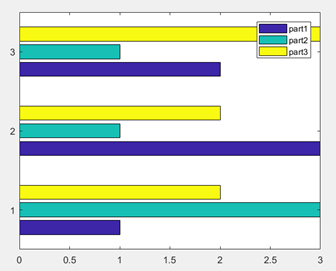
x=[1 2 3];
y=[1 3 2; 3 1 2; 2 1 3];
barh(x, y, 'group');
legend('part1', 'part2', 'part3');
11. 饼图pie
x=[1,2,3,4,5];
subplot(1,2,1);
pie(x,[1 0 0 0 0]);
legend({'part1','part2','part3','part4','part5'},'Location','Best');
subplot(1,2,2);
y=int8(x==max(x))
pie3(x,y)
colormap(cool

12. 离散杆图stem
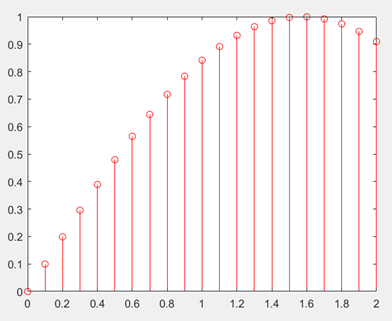
x = 0:0.1:2;
y = sin(x);
stem(x,y,'r');
13.极坐标polar
theta = 0:0.01:2*pi;
rho = sin(2*theta).*cos(2*theta);
polar(theta,rho,'-.r');

三维绘图
1. plot3 与plot类似 :x,y,z 指定为相同长度的向量
t=(0:0.02:2)*pi;
x=sin(t);
y=cos(t);
z=cos(2*t);
plot3(x,y,z,'-',x,y,z,'rh');
grid on;

2. 三维网线图(mesh)
需要先用meshgrid产生“格点”矩阵
3. 曲面图(surf)
需要先用meshgrid产生“格点”矩阵
x=-5:0.1:5;
y=-5:0.1:5;
[x,y]=meshgrid(x,y);
z=sin(x).*cos(y);
subplot(1,2,1), mesh(x,y,z);title('mesh');
subplot(1,2,2), surf(x,y,z);title('surf');
colormap(cool);

