发现高密度的核心样品并从中膨胀团簇。
Python代码如下:
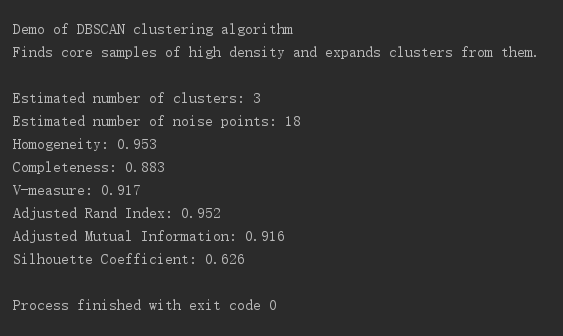
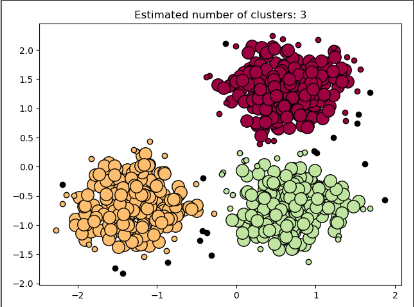
 1 # -*- coding: utf-8 -*-
 2 """
 3 Demo of DBSCAN clustering algorithm
 4 Finds core samples of high density and expands clusters from them.
 5 """
 6 print(__doc__)
 7 # 引入相关包
 8 import numpy as np
 9 from sklearn.cluster import DBSCAN
10 from sklearn import metrics
11 from sklearn.datasets.samples_generator import make_blobs
12 from sklearn.preprocessing import StandardScaler
13 import matplotlib.pyplot as plt
14 # 初始化样本数据
15 centers = [[1, 1], [-1, -1], [1, -1]]
16 X, labels_true = make_blobs(n_samples=750, centers=centers, cluster_std=0.4,
17                             random_state=0)
18 X = StandardScaler().fit_transform(X)
19 # 计算DBSCAN
20 db = DBSCAN(eps=0.3, min_samples=10).fit(X)
21 core_samples_mask = np.zeros_like(db.labels_, dtype=bool)
22 core_samples_mask[db.core_sample_indices_] = True
23 labels = db.labels_
24 # 聚类的结果
25 n_clusters_ = len(set(labels)) - (1 if -1 in labels else 0)
26 n_noise_ = list(labels).count(-1)
27 print('Estimated number of clusters: %d' % n_clusters_)
28 print('Estimated number of noise points: %d' % n_noise_)
29 print("Homogeneity: %0.3f" % metrics.homogeneity_score(labels_true, labels))
30 print("Completeness: %0.3f" % metrics.completeness_score(labels_true, labels))
31 print("V-measure: %0.3f" % metrics.v_measure_score(labels_true, labels))
32 print("Adjusted Rand Index: %0.3f"
33       % metrics.adjusted_rand_score(labels_true, labels))
34 print("Adjusted Mutual Information: %0.3f"
35       % metrics.adjusted_mutual_info_score(labels_true, labels,
36                                            average_method='arithmetic'))
37 print("Silhouette Coefficient: %0.3f"
38       % metrics.silhouette_score(X, labels))
39 # 绘出结果
40 unique_labels = set(labels)
41 colors = [plt.cm.Spectral(each)
42           for each in np.linspace(0, 1, len(unique_labels))]
43 for k, col in zip(unique_labels, colors):
44     if k == -1:
45         col = [0, 0, 0, 1]
46     class_member_mask = (labels == k)
47     xy = X[class_member_mask & core_samples_mask]
48     plt.plot(xy[:, 0], xy[:, 1], 'o', markerfacecolor=tuple(col),
49              markeredgecolor='k', markersize=14)
50     xy = X[class_member_mask & ~core_samples_mask]
51     plt.plot(xy[:, 0], xy[:, 1], 'o', markerfacecolor=tuple(col),
52              markeredgecolor='k', markersize=6)
53 plt.title('Estimated number of clusters: %d' % n_clusters_)
54 plt.show()
测试结果如下:
最终结果绘图:
具体数据: