前期准备
Echarts.js文件
<template>
  <div :id="id"></div>
</template>
<script>
  import echarts from 'echarts'
  import chinaJSON from '@/assets/data/chinaMap.json'
  echarts.registerMap('china', chinaJSON)
  export default {
    data () {
      return {
        chart: null
      }
    },
    props: ['id', 'option'],
    mounted () {
      let vm = this
      this.chart = echarts.init(document.getElementById(this.id))
      let baseOption = {
      }
      let options = Object.assign({}, baseOption, this.option)
      this.chart.setOption(options, {
                notMerge:true,
      })
      this.chart.on('click', function (params) {
        vm.$emit('click-chart', params)
      })
    },
    watch: {
      option: {
        handler (val, oldVal) {
          this.chart.clear()
          this.chart.setOption(val)
        },
        deep: true
      }
    },
    // beforeDestroy(){
    //   this.chart.dispose()
    // }
  }
</script>
文件chartOption.js
export function lineOptionTime(data, xname,yname) { let seriesData = [] for (let n in data) { let seriesObj = { name: data[n].text, type: 'line', color: data[n].color, smooth: true, // symbol: 'none', symbol:'circle', showSymbol: false, //这两个属性可以让折线图只在鼠标进入的时候在该数据画点,而不每个数据都画点,因为每个数据都画点在数据量大的时候会非常卡。 // areaStyle: {},//线到x轴空间区域填充 data: data[n].data } seriesData.push(seriesObj) } const option = { tooltip: { trigger: "axis", axisPointer: { // 坐标轴指示器,坐标轴触发有效 type: 'shadow' // 默认为直线,可选为:'line' | 'shadow' }, formatter: (params) => { // console.log("params", params) var result = params[0].data[0] + '</br>' params.forEach(item => { if (item.data) { result += `${item.marker}<span>${item.seriesName} ${item.data[1]}</span></br>` } }) return result; } }, legend: { top: 0, right: 10, itemWidth: 6, itemHeight: 6, icon: 'circle', itemGap: 6, data: data.map(v => { return v.text }) }, grid: { left: "2%", right: "4%", top: "10%", containLabel: true }, xAxis: { type: 'time', name: xname, boundaryGap: false, axisLine: { show: false }, axisLabel: { color: '#555' }, axisTick: { show: false }, splitLine: { show: false } }, yAxis: { type: 'value', name: yname, boundaryGap: [0, '100%'], splitLine: { lineStyle: { type: "dashed", color: "#DDD" } }, axisLine: { show: false, lineStyle: { color: "#999" } }, axisTick: { show: false }, nameTextStyle: { color: "#555" }, splitArea: { show: false }, max: function(value) { console.log("value",value.max) let n = (value.max + "").split(".")[0].length let pow = Math.pow(10, n -1) // 10, 100, 1000,..... let floorNUm = Math.floor(value.max / pow) //1,2,3,4,5,..... let max = (floorNUm + 1) * pow console.log("max", max ? max : 200) return max ? max : 200; } }, dataZoom: [ { type: 'inside', start: 0, end: 20 }, { start: 0, end: 20 } ], series: seriesData } return option }
文件中使用
<echart
    id="trend_dynamic_vol_diff"
    :option="option['trend_dynamic_vol_diff']"
    ></echart>
import {Echarts} from "@/components
components: {
    Echarts
}
created(){
    let yData = {
        color: 'XXXX', // 随便写颜色值
        text: 'xxxx', // 每条线的名字
        data: [
            ['2020-01-02 10:02:24', 263],
            ['2020-01-03 01:10:20', 23],
            ['2020-01-04 9:02:14', 82],
            ['2020-01-05 10:35:54', 33],
            ['2020-01-05 12:02:24', 227]
        ]
    }
    //yData只是举例了一组数据,数据量大的时候可以有n组
this.option["trend_dynamic_vol_diff"] =     lineOptionTime(
              yData,
              "日期",
              "压差(mv)",
            );
}
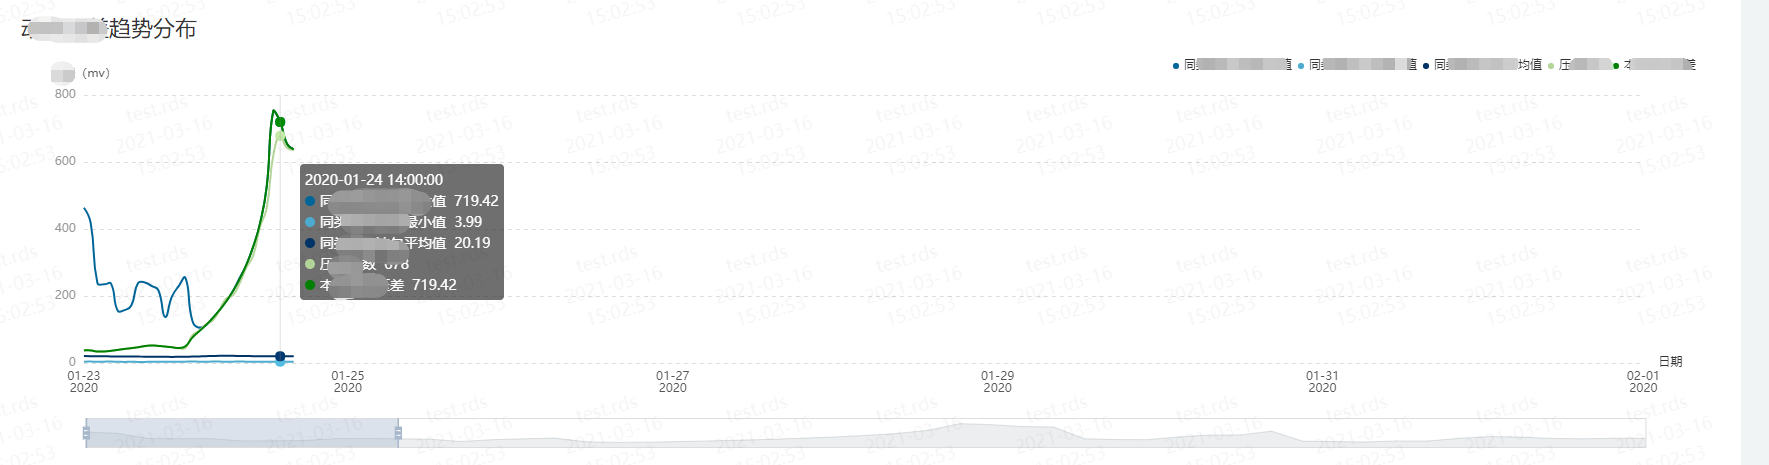
效果图如下: