
[root@lizhipeng01 ~]# iostat
Linux 3.10.0-229.el7.x86_64 (lizhipeng01) 2018年01月21日 _x86_64_ (1 CPU)
avg-cpu: %user %nice %system %iowait %steal %idle
0.13 0.00 0.34 0.14 0.00 99.39
Device: tps kB_read/s kB_wrtn/s kB_read kB_wrtn
sda 0.83 18.28 10.05 160409 88139
sdb 0.03 0.11 0.23 958 2048
dm-0 0.82 17.54 9.81 153867 86079
dm-1 0.03 0.10 0.00 884 0
[root@lizhipeng01 ~]# iostat -x
Linux 3.10.0-229.el7.x86_64 (lizhipeng01) 2018年01月21日 _x86_64_ (1 CPU)
avg-cpu: %user %nice %system %iowait %steal %idle
0.15 0.00 0.32 0.12 0.00 99.40
Device: rrqm/s wrqm/s r/s w/s rkB/s wkB/s avgrq-sz avgqu-sz await r_await w_await svctm %util 关注%util
sda 0.06 0.04 0.52 0.21 15.66 8.78 66.79 0.02 20.94 11.06 45.44 4.89 0.36
sdb 0.00 0.00 0.03 0.00 0.09 0.20 20.73 0.00 2.11 1.61 38.00 1.73 0.00
dm-0 0.00 0.00 0.50 0.23 15.03 8.58 64.78 0.02 25.85 11.98 55.46 4.83 0.35
dm-1 0.00 0.00 0.02 0.00 0.09 0.00 8.00 0.00 2.81 2.81 0.00 2.17 0.00
[root@lizhipeng01 ~]# free
total used free shared buff/cache available
Mem: 1003160 131072 573664 6772 298424 695764 单位为k
Swap: 2097148 0 2097148
[root@lizhipeng01 ~]# free -h
total used free shared buff/cache available
Mem: 979M 127M 560M 6.6M 291M 679M
Swap: 2.0G 0B 2.0G

[root@lizhipeng01 ~]# ps aux |grep nginx
root 2966 0.0 0.0 112672 980 pts/0 S+ 21:45 0:00 grep --color=auto nginx
[root@lizhipeng01 ~]# ps aux |grep mysql
root 2968 0.0 0.0 112672 980 pts/0 R+ 21:45 0:00 grep --color=auto mysql
[root@lizhipeng01 ~]# vmstat 1
procs -----------memory---------- ---swap-- -----io---- -system-- ------cpu-----
r b swpd free buff cache si so bi bo in cs us sy id wa st
2 0 0 573276 764 298124 0 0 10 6 18 22 0 0 100 0 0
0 0 0 573260 764 298124 0 0 0 0 17 21 0 0 100 0 0
0 0 0 573260 764 298124 0 0 0 0 17 15 0 0 100 0 0
0 0 0 573260 764 298124 0 0 0 0 18 14 0 1 99 0 0
^Z
[1]+ 已停止 vmstat 1
[root@lizhipeng01 ~]# ps aux |grep vmstat
root 2979 0.0 0.0 120668 912 pts/0 T 21:59 0:00 vmstat 1 T暂停
root 2981 0.0 0.0 112672 980 pts/0 R+ 21:59 0:00 grep --color=auto vmstat
Last login: Sun Jan 21 17:38:05 2018 from 192.168.5.1 复制另一个终端
[root@lizhipeng01 ~]# ps aux |grep vmstat
root 2979 0.0 0.0 120668 912 pts/0 S+ 21:59 0:00 vmstat 1
root 3032 0.0 0.0 112672 980 pts/1 R+ 22:01 0:00 grep --color=auto vmstat

[root@lizhipeng01 ~]# netstat -lnp
Active Internet connections (only servers)
Proto Recv-Q Send-Q Local Address Foreign Address State PID/Program name
tcp 0 0 0.0.0.0:22 0.0.0.0:* LISTEN 1412/sshd
tcp 0 0 127.0.0.1:25 0.0.0.0:* LISTEN 2407/master
tcp6 0 0 :::22 :::* LISTEN 1412/sshd
tcp6 0 0 ::1:25 :::* LISTEN 2407/master
raw6 0 0 :::58 :::* 7 941/NetworkManager
Active UNIX domain sockets (only servers)
[root@lizhipeng01 ~]# netstat -an 所有的连接状态 all
Active Internet connections (servers and established)
Proto Recv-Q Send-Q Local Address Foreign Address State
tcp 0 0 0.0.0.0:22 0.0.0.0:* LISTEN
tcp 0 0 127.0.0.1:25 0.0.0.0:* LISTEN
tcp 0 52 192.168.5.128:22 192.168.5.1:4101 ESTABLISHED
tcp6 0 0 :::22 :::* LISTEN
tcp6 0 0 ::1:25 :::* LISTEN
raw6 0 0 :::58 :::* 7
Active UNIX domain sockets (servers and established)
[root@lizhipeng01 ~]# netstat -ltnp t代表tcp
Active Internet connections (only servers)
Proto Recv-Q Send-Q Local Address Foreign Address State PID/Program name
tcp 0 0 0.0.0.0:22 0.0.0.0:* LISTEN 1412/sshd
tcp 0 0 127.0.0.1:25 0.0.0.0:* LISTEN 2407/master
tcp6 0 0 :::22 :::* LISTEN 1412/sshd
tcp6 0 0 ::1:25 :::* LISTEN 2407/master
[root@lizhipeng01 ~]# netstat -ltunp u代表udp
Active Internet connections (only servers)
Proto Recv-Q Send-Q Local Address Foreign Address State PID/Program name
tcp 0 0 0.0.0.0:22 0.0.0.0:* LISTEN 1412/sshd
tcp 0 0 127.0.0.1:25 0.0.0.0:* LISTEN 2407/master
tcp6 0 0 :::22 :::* LISTEN 1412/sshd
tcp6 0 0 ::1:25 :::* LISTEN 2407/master
[root@lizhipeng01 ~]# netstat -an |awk '/^tcp/{++sta[$NF]} END {for(key in sta) print key," ",sta[key]}'
LISTEN 4
ESTABLISHED 1
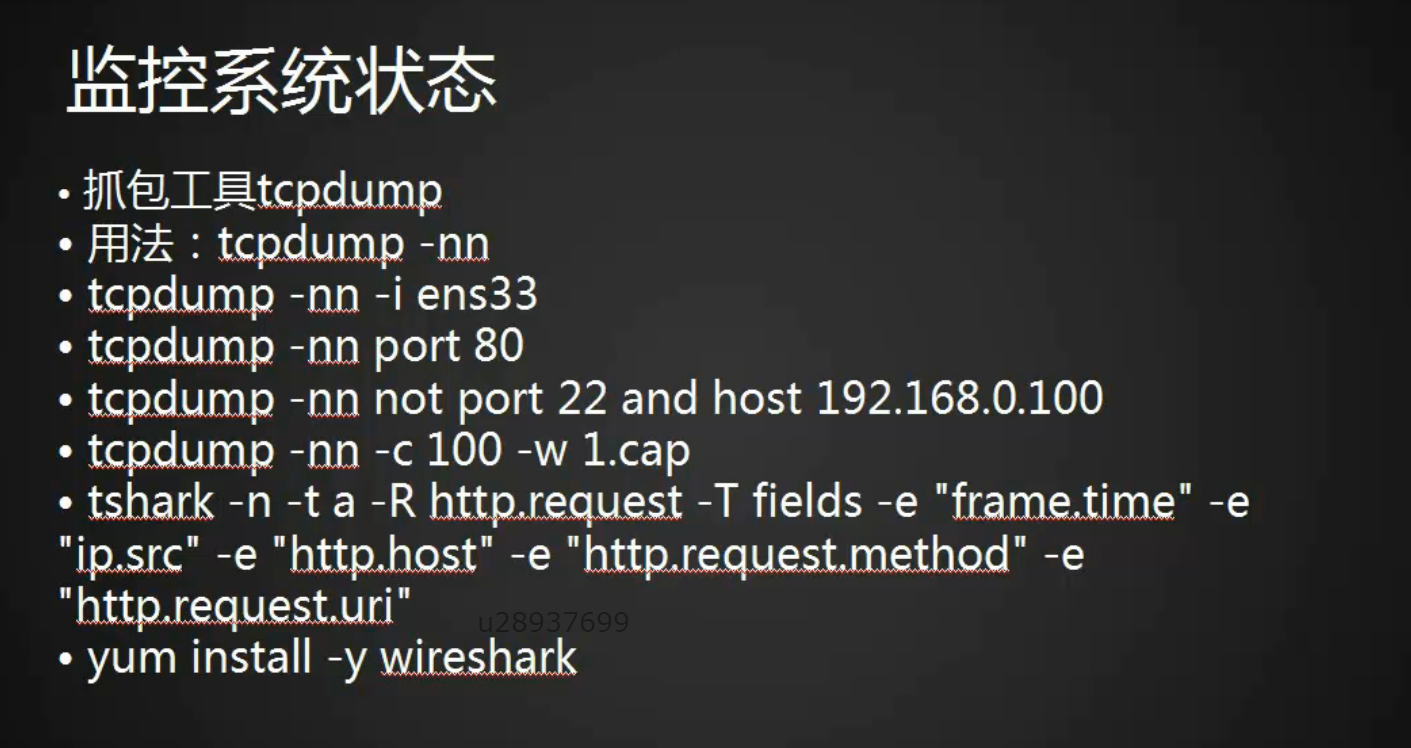
[root@lizhipeng01 ~]# tcpdump -nn-i eno16777736 网卡名字
[root@lizhipeng01 ~]# tcpdump -nn -i eno16777736 -c 100 -w /tmp/1.cap 抓100个包写到 /tmp/1.cap
tcpdump: listening on eno16777736, link-type EN10MB (Ethernet), capture size 262144 bytes
100 packets captured
101 packets received by filter
0 packets dropped by kernel
[root@lizhipeng01 ~]# file /tmp/1.cap
/tmp/1.cap: tcpdump capture file (little-endian) - version 2.4 (Ethernet, capture length 262144)
[root@lizhipeng01 ~]# tcpdump -r /tmp/1.cap 查看包
reading from file /tmp/1.cap, link-type EN10MB (Ethernet)
23:27:01.137023 IP 192.168.5.128.ssh > 192.168.5.1.brlp-0: Flags [P.], seq 2382139286:2382139434, ack 779130445, win 182, length 148
23:27:01.187588 IP 192.168.5.1.brlp-0 > 192.168.5.128.ssh: Flags [.], ack 148, win 2049, length 0
23:27:01.884722 IP 192.168.5.128.ssh > 192.168.5.1.brlp-0: Flags [P.], seq 148:280, ack 1, win 182, length 132
23:27:01.935363 IP 192.168.5.1.brlp-0 > 192.168.5.128.ssh: Flags [.], ack 280, win 2048, length 0
23:27:02.891551 IP 192.168.5.128.ssh > 192.168.5.1.brlp-0: Flags [P.], seq 280:428, ack 1, win 182, length 148
23:27:02.942657 IP 192.168.5.1.brlp-0 > 192.168.5.128.ssh: Flags [.], ack 428, win 2048, length 0
23:27:03.758170 IP 192.168.5.1.brlp-0 > 192.168.5.128.ssh: Flags [P.], seq 1:53, ack 428, win 2048, length 52
23:27:03.798154 IP 192.168.5.128.ssh > 192.168.5.1.brlp-0: Flags [.], ack 53, win 182, length 0
23:27:03.893880 IP 192.168.5.128.ssh > 192.168.5.1.brlp-0: Flags [P.], seq 428:576, ack 53, win 182, length 148
23:27:03.944320 IP 192.168.5.1.brlp-0 > 192.168.5.128.ssh: Flags [.], ack 576, win 2047, length 0
23:27:04.897714 IP 192.168.5.128.ssh > 192.168.5.1.brlp-0: Flags [P.], seq 576:708, ack 53, win 182, length 132
23:27:04.949946 IP 192.168.5.1.brlp-0 > 192.168.5.128.ssh: Flags [.], ack 708, win 2053, length 0
23:27:05.898478 IP 192.168.5.128.ssh > 192.168.5.1.brlp-0: Flags [P.], seq 708:856, ack 53, win 1
[root@lizhipeng01 ~]# yum install wireshark
[root@lizhipeng01 ~]# tshark -n -t -a -R http.request -T fields -e "frame.time" -e "ip.src" -e "http.host" -e "http.request.method" -e "http.request.uri"