简单的绘图
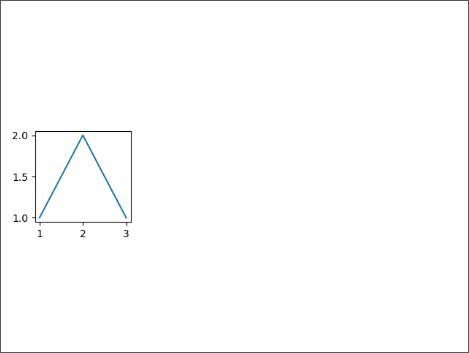
1.确定画布并画线
import matplotlib.pyplot as plt

#静态绘图
fig = plt.figure()
ax = fig.add_subplot(345)  #画布设置 为3行 4列 位置5
x = [1, 2, 3]
y = [1, 2, 1]
ax.plot(x, y)
plt.show()
结果:
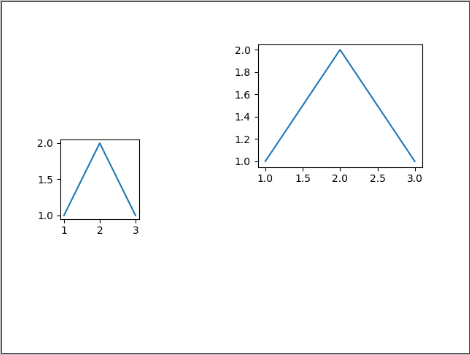
2.绘制子图
import matplotlib.pyplot as plt

#静态绘图
fig = plt.figure()
ax = fig.add_subplot(345)
x = [1, 2, 3]
y = [1, 2, 1]
ax.plot(x, y)

ax = fig.add_subplot(222)  #画布设置 为2行 2列 位置2
ax.plot(x, y)
plt.show()
结果:
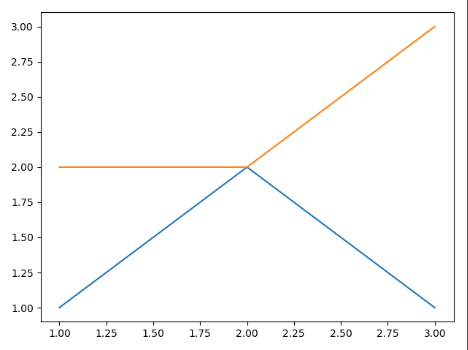
3.绘制2条线
import matplotlib.pyplot as plt

#静态绘图
fig = plt.figure()
ax = fig.add_subplot(111)
x = [1, 2, 3]
y = [1, 2, 1]
ax.plot(x, y)

x = [1, 2, 3]
y = [2, 2, 3]
ax.plot(x, y)
plt.show()
结果:
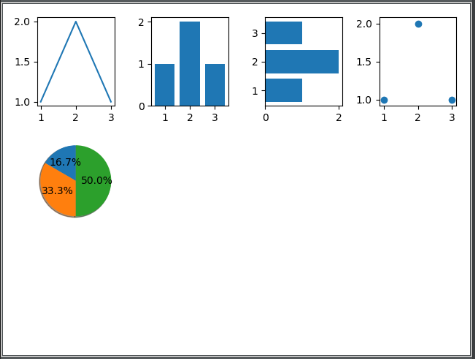
4.绘制其它类型子图
import matplotlib.pyplot as plt

# 静态绘图
fig = plt.figure()
ax = fig.add_subplot(341)
x = [1, 2, 3]
y = [1, 2, 1]
ax.plot(x, y)

ax = fig.add_subplot(342)
ax.bar(x, y)

ax = fig.add_subplot(343)
ax.barh(x, y)

ax = fig.add_subplot(344)
ax.scatter(x, y)

ax = fig.add_subplot(345)
ax.pie(x,  autopct='%1.1f%%', shadow=True, startangle=90)
ax.axis('equal')

plt.show()
结果: