#-*- coding: utf-8 -*-
import matplotlib.pyplot as plt
import numpy as np
import matplotlib as mpl
mpl.rcParams['font.family']='sans-serif'
mpl.rcParams['font.sans-serif']=[u'SimHei']
data=np.random.randint(1,11,3)
x=np.arange(len(data))
############
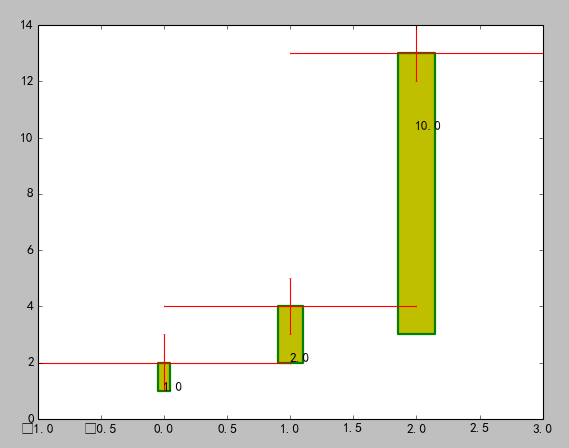
# 柱状图 bar/barh
rects1=plt.bar( #(x,data) 就是所要画的二维数据
left=x, #x 是X坐标轴数据,即每个块的x轴起始位置
height=data, #data是Y坐标轴的数据,即每个块的y轴高度
width=[0.1,0.2,0.3], #每一个块的显示宽度
bottom=[1,2,3], #每一个块的底部高度
color='y', #块的颜色
edgecolor='g', #块的边界颜色
linewidth=2, #块的线条宽度
xerr=1, #x轴误差bar
yerr=1, #y轴误差bar
ecolor='r', #误差bar的颜色
capsize=1, #误差bar的线条宽度
orientation='vertical', #块的方向 (horizontal,vertical)
align="center", #块的位置 (center, left, right)
hold=None
)
plt.show()
#######################
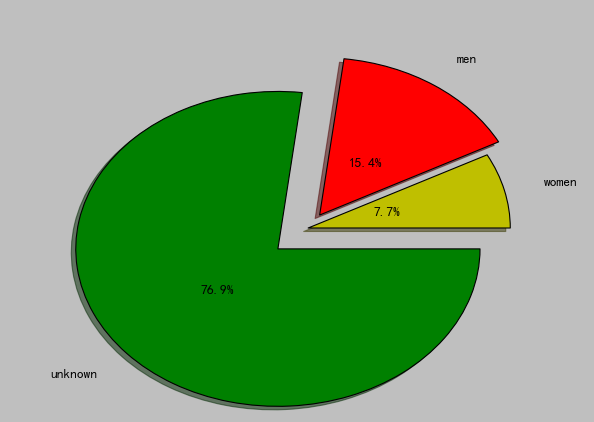
# 饼状图 pie
plot2=plt.pie(data, # 每个饼块的实际数据,如果大于1,会进行归一化,计算percentage
explode=[0.0,0.1,0.2], # 每个饼块离中心的距离
colors=['y','r','g'], # 每个饼块的颜色
labels=['women','men','unknown'], # 每个饼块的标签
labeldistance=1.2, # 每个饼块标签到中心的距离
autopct='%1.1f%%', # 百分比的显示格式
pctdistance=0.4, # 百分比到中心的距离
shadow=True, # 每个饼块是否显示阴影
startangle=0, # 默认从x轴正半轴逆时针起
radius=1.0 # 饼块的半径
)
# pl.legend([plot1, plot2], (’red line’, ’green circles’), ’best’, numpoints=1) # make legend
plt.show()
#############################
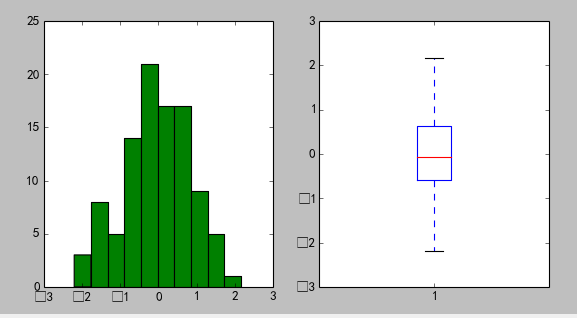
## 直方图 hist, 盒图boxplot
data=np.random.randn(100)
print(data)
fig,(ax1,ax2)=plt.subplots(1,2,figsize=(8,4))
ax1.hist(data) #
ax2.boxplot(data)
plt.show()
柱状图 bar(水平柱状图 barh即可)
饼图 pie
直方图hist 和盒图 boxplot