一,Nagios监控简介
- 生活中大家应该对监控已司空见惯了,例如:餐馆门前的监控探头,小区里的视频监控,城市道路告诉监控探头等,这些监控的目的大家都很清楚,无须多说。那么,企业工作中为什么要部署监控系统呢?
- 我们都知道军队里,哨兵的角色很重要,我们在杀敌前,基本都要先把敌人站岗的哨兵给解决了,这样敌人就相当于眼睛瞎了,耳朵聋了,然后再进攻就能轻松搞定这些敌人。在互联网企业大型网站架构里,服务器,业务系统相当多,可达上万甚至十万级别,而且还很复杂,如果没有监控系统这个“哨兵”,网络业务出现什么问题,我们就很难知晓,因此,大型网站中监控系统的重要性就不言而喻了。
监控系统需要监控的数据有哪些呢?
- 系统本地资源:负载(uptime),CPU(top,sar),磁盘(df -hi),内存(free),I/O(iostat),Raid内磁盘故障,CPU温度,passwd文件的变化,本地所有文件改动。
- 网络服务:端口,Web(URL),DB,ping包,进程,IDC带宽网络流量。
- 其他设备:路由器,交换机(端口,光衰,日志),打印机,windows等。
- 业务数据:用户登录失败次数,用户登陆网站次数,输入验证码失败的次数,某个API接口流量并发,网络连接数,IP,PV数,电商网站订单,支付交易的数量等。
如何获取到这么多的数据呢?
Nagios监控软件本身仅仅是一个监控平台,理论上想监控的具体内容只要在服务器中执行命令行就可以获取,并纳入Nagios监控体系里。
二,Nagios监控工具及原理介绍
2.1 Nagios介绍
- Nagios是一款开源的网络及服务的监控工具,其功能强大,灵活性强。能有效监控Windows,Linux和UNIX等系统的主机各种状态信息,以及交换机,路由器等网络设备和主机端口及URL服务等,它会根据不同业务故障级别发出告警信息(邮件,微信,短信,语音报警,飞信),当故障恢复时也会发出对应的恢复消息给管理员。
- Nagios服务器端可以在Linux系统和类UNIX系统上运行,但目前无法在Windows上运行。Windows可以作为被监控的主机运行Nagios客户端软件。
- Nagios监控软件本身仅仅是一个监控平台,我们想监控的具体内容,理论上只要通过服务器命令就可以获取并纳入Nagios监控体系里,所以,可以说Nagios强大到了无所不能的地步。
- Nagios官方网站地址为http://www.nagios.org/.
2.2 Nagios的特点
Nagios可以支持非常多的功能特性,这里把一些常见的功能特性简单介绍如下:
- 监控网络服务(HTTP,TCP,PING,SMTP,POP3等)
- 监控主机资源(CPU,负载,I/O状况,虚拟及正式内存及磁盘利用率等)
- 简单的插件设计模式使得用户可以很方便地定制符合自己服务的检测方法
- 并行服务检查机制
- 具备定义网络分层结构的能力,用“parent”主机定义来表达网络主机间的关系,这种关系可被用来发现和明晰主机宕机或不可达的状态。
- 当服务或主机问题产生与解决后将及时通报联系人(mail/im/sms/sound/语音)
- 具备定义事件句柄功能,它可以在主机或服务的事件发生时获取更多问题定位
- 自动的日志回滚
- 可以支持并实现对主机的冗余监控(支持分布式监控)
- 可选的Web界面用于查看当前的网络状态,通知和故障历史,日志文件等。
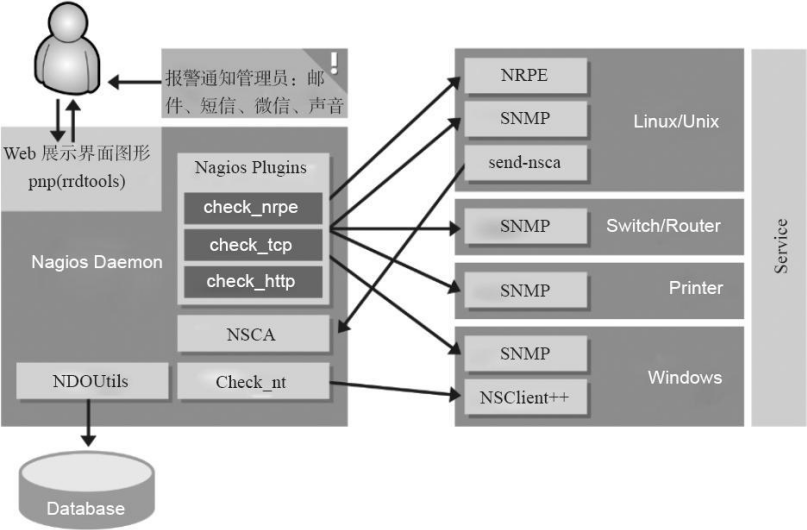
2.3 Nagios监控系统家族成员的构成
- Nagios监控一般由一个主程序(Nagios),一个插件程序(Nagios-plugins)和一些可选的附加程序(NRPE,NSClient++,NSCA和NDOUtils)等组成。
- Nagios本身只是一个监控的平台而已,其具体的监控工作都是通过各类插件(例如:Nagios-plugins)来实现的,也可以自己编写插件。因此,Nagios主程序和Nagios-plugins插件都是Nagios服务器端必须要安装的程序组件,不过,一般Nagios-plugins也要安装于被监控端,用来获取相应的数据。Nagios可选的附加组件描述如下:
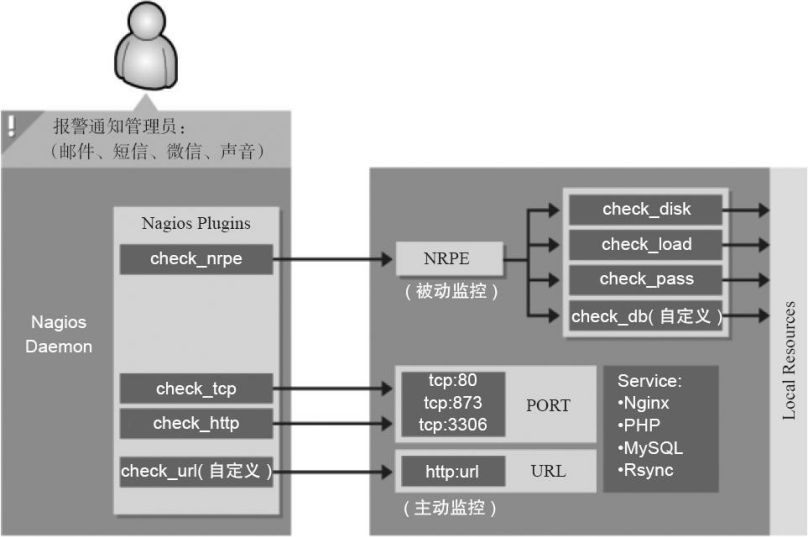
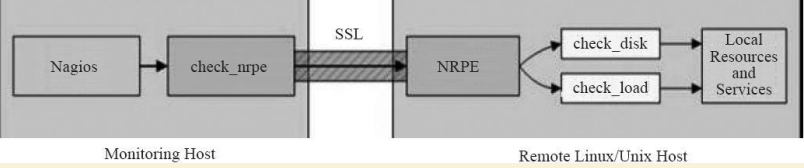
(1)NRPE组件(重点)
- 存在的位置:工作于被监控端,操作系统为Linux/UNIX系统
- 作用:用于在被监控的远程Linux/UNIX主机上执行脚本插件,获取数据回传给服务器端,以实现对这些主机资源和服务的监控。
- 存在形式:守护进程(agent)模式,开启的端口为5666
- 监控的资源:主要用于监控本地资源,包括负载(uptime),CPU(top,sar),磁盘(df -hi),内存(free),I/O(iostat),Raid内磁盘故障,CPU温度,passwd文件的变化,以及本地所有文件的指纹识别监控,当然也可以监控进程,端口,URL等。
下图为NRPE组件的运行原理图:
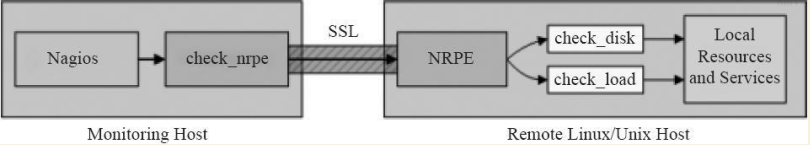
- 工作原理:通常由Nagios服务器端发起获取数据请求,由check_nrpe插件携带要获取的命令,传给被监控端的nrpe守护进程(默认5666端口),nrpe进程读取nrpe.cfg里对应服务器端发送的命令信息,调用本地插件获取数据,然后返回给Naios服务器端check_nrpe,进而传给Nagios展示到Web界面中,严格讲可以称之为半被动工作模式,本文主要讲解这个NRPE组件的功能,后文将称其为被动模式。
(2)NSClient++组件(仅了解)
NSClient++组件用于被监控端为Windows系统的服务器。
- 作用:相当于Linux下的nrpe,监控安装在Windows主机上的agent组件。
- 监控的资源:主要监控Windows系统的本地资源,比如CPU,磁盘,内存,I/O等。
- 工作形式:通常由服务器端发起获取数据请求,由check_nt传给被监控端的NSClient++进程,获取数据后返回给服务器端。
下图为NSClient++运行原理图:
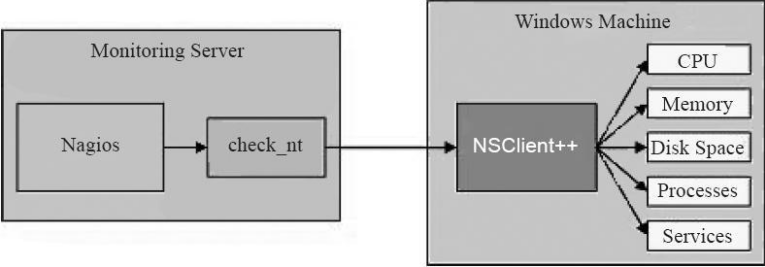
- 工作原理:NSClient++的工作原理和NRPE基本相同,只不过适合于Windows被监控端的监控,且服务器端的插件为check_nt,客户端的进程为NSClient++。通常由服务器端发起获取数据请求,由check_nt传给被监控端的NSClient++进程,获取数据后返回给服务器端,本节内容不会涉及Windows被监控端,感兴趣的同学们自行百度研究解决。
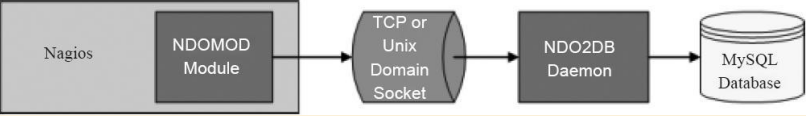
(3)NDOUtils组件(不推荐用)
NDOUtils组件工作于Nagios服务器端
- 作用:将Nagios的配置信息和各event产生的数据存入数据库,以实现对这些数据的检索和处理,对于中小企业,不推荐使用NDOUtils,直接使用文件记录数据就很好。
下图为NDOUtils的运行原理简图:
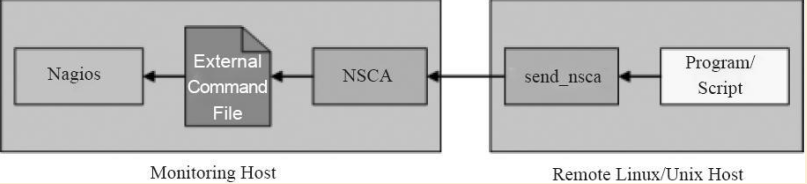
(4)NSCA组件(仅了解)
- 相对于nrpe,这个可以说是纯被动模式的监控组件,目前被应用的场景较少,这里只是作为知识点进行介绍,对于中小企业,并不推荐使用。
NSCA需要同时安装在Nagios的服务器端和客户端(被监控端)
- 作用:让被监控的远程Linux/UNIX主机主动将监控到的信息发送给Nagios服务器,可以用在大规模分布式监控集群模式中,中小企业无需使用。
分布式监控NSCA外部构件简介:
为完成从远程主机主动提交强制检测结果,于是就开发了NSCA外部构件。该外部构件包括两部分,第一部分是客户端程序(send_nsca),运行于远程主机上,并负责将强制检测结果发送到指定的Nagios服务器端,另一部分是NSCA守护进程(nsca),它既可以作为守护进程独立运行,也可以注册到inetd里作为一个inetd客户程序来提供监听。从客户端收到服务检测结果信息之后,守护进程将结果提交给在中心服务器的Nagios,方式是在外部命令文件里插入一条PROCESS_SVC_CHECK_RESULT命令,之后跟上检测结果。在Nagios服务器端下一次处理外部命令时将会找到这条由分布式服务器送来的强制监测信息并处理它。
下图为NSCA分布式监控运行原理简图:
2.4 Nagios监控系统完整图解
下图为Nagios监控工具综合系统简单原理图。该系统在中小企业用不到,也没必要搞得这么复杂,这里会对将要讲解的Nagios系统做了一个剪裁,只讲解企业最常见的功能应用,对一般的企业已经足够了。
运维思想:化繁为简是优秀的运维工程师必须掌握的重要技术思想。
下图是接下来要详细讲解的Nagios监控工具实际原理简图。这张原理图符合生产运维的原则:简单,易用,高效。
三,Nagios服务器端安装
3.1 Nagios安装准备
(1)准备3台服务器或VM虚拟机
下表为Nagios服务器及客户端服务器列表
| 管理IP地址 | 角色 | 备注 |
|---|---|---|
| 192.168.0.200 | nagios-server | Nagios服务器端 |
| 192.168.0.223 | web01 | 被监控的客户端服务器 |
| 192.168.0.224 | web02 | 被监控的客户端服务器 |
(2)设置yum公网安装源
- 默认情况执行yum会从国外的站点下载,速度慢。因此要换成国内的提供yum源的站点,这样安装软件时更快。yum是一个非常方便的RPM软件包安装命令,一般安装基础的软件都会用到。命令语法为:yum install软件包名或关键字-y。
#阿里云yum源
wget -O /etc/yum.repos.d/CentOS-Base.repo http://mirrors.aliyun.com/repo/Centos-6.repo
(3)解决Perl软件编译问题
在安装好Nagios监控服务后,还要安装Perl插件程序,因此要提前设置相关环境变量,批量执行命令如下:
[root@Nagios ~]# echo 'export LC_ALL=C' >> /etc/profile
[root@Nagios ~]# tail -1 /etc/profile
export LC_ALL=C
[root@Nagios ~]# source /etc/profile
[root@Nagios ~]# echo $LC_ALL
C
(4)关闭Nagios server端防火墙及SELinux
在测试环境下为了调试方便,最好关掉iptalbes防火墙及SELinux,如果是生产环境中,因为有外部IP,所以在调试完毕后需要开启防火墙。一般允许服务通过的方法是整个局域网IP段都通过,SELinux是一个可关可开的软件,企业可以根据需求选择,大部分企业还是会选择关闭SELinux,使用其他保护措施,因此,这里也关闭SELinux。
(5)解决系统时间同步问题
如果不解决服务器的时间同步问题,很可能会导致Nagios整个服务配置异常甚至失败,这个是很多同学初学时不太注意的地方,Nagios一度被称为“难够死”,意思是太难配置了,不过只要同学们认真听,认真学,相信你会感觉很轻松。
[root@Nagios ~]# which ntpdate
/usr/sbin/ntpdate
[root@Nagios ~]# /usr/sbin/ntpdate pool.ntp.org
12 Aug 11:29:43 ntpdate[1434]: step time server 51.174.131.248 offset -28704.196738 sec
#让Nagios server的系统时间和当前的标准时间保持一致。虚拟机要能上网才行
[root@Nagios ~]# date +%F
2017-08-12
[root@Nagios ~]# echo '#time sync by Mr.chen at 2017-08-12' >> /var/spool/cron/root
[root@Nagios ~]# echo '*/5 * * * * /usr/sbin/ntpdate pool.ntp.org >/dev/null 2>&1' >> /var/spool/cron/root
[root@Nagios ~]# crontab -l
#time sync by Mr.chen at 2017-08-12
*/5 * * * * /usr/sbin/ntpdate pool.ntp.org >/dev/null 2>&1

#<==执行命令将同步时间加入定时任务队列。
(6)安装Nagios服务器端所需软件包
- Nagios服务器端需要有Web界面展示监控效果,界面的展示主要使用PHP程序,因此,需要LAMP环境
- 特别强调:有些网友总想安装LNMP环境,这完全自找麻烦,yum安装的LAMP环境是配合Nagios服务器端展示界面的最佳环境。
[root@Nagios ~]# yum -y install gcc glibc glibc-common
#编译软件升级
[root@Nagios ~]# yum -y install gd gd-devel
#用于后面PHP出图的包
[root@Nagios ~]# yum -y install mysql-server
#非必须,如果有监控数据库,那么需要先安装MySQL,否则,MySQL的相关插件不会被安装
yum -y install httpd php php-gd
#Apache,PHP环境
[root@Nagios ~]# rpm -qa mysql httpd php
httpd-2.2.15-60.el6.centos.4.x86_64
mysql-5.1.73-8.el6_8.x86_64
php-5.3.3-49.el6.x86_64
#检查LAMP环境的版本
提示:
1)通过yum工具安装上述所有软件包,且这些环境一般不需要在Nagios客户端安装
2)上述软件包装好后的版本为:Apache2.2.15,PHP5.3.3,MySQL5.1.73
(7)创建Nagios服务器端需要的用户及组
批量执行命令如下:
[root@Nagios ~]# useradd nagios     #创建用户(需要加目录,否则,启动Nagios会提醒没家目录)
[root@Nagios ~]# groupadd nagcmd    #添加用户组
[root@Nagios ~]# usermod -a -G nagcmd nagios    #将nagios加入组
[root@Nagios ~]# usermod -a -G nagcmd apache    #将apache加入组
[root@Nagios ~]# id -n -G nagios    #查看用户及用户组
nagios nagcmd
[root@Nagios ~]# id -n -G apache    #查看用户及用户组
apache nagcmd
(8)上传软件包到指定目录或通过URL下载
相关软件包可以去下载。
地址:http://sourceforge.net/projects/nagios/files/
http://www.nagios-plugins.org/download/nagios-plugins-1.4.16.tar.gz
为了方便同学们学习安装Nagios,已经收集好了相关软件包,内容如下:
[root@Nagios ~]# tree nagios/
nagios/
|-- Class-Accessor-0.31.tar.gz      #iostat插件需要
|-- Config-Tiny-2.12.tar.gz         #iostat插件需要
|-- Math-Calc-Units-1.07.tar.gz     #iostat插件需要
|-- Nagios-Plugin-0.34.tar.gz       #iostat插件需要
|-- Params-Validate-0.91.tar.gz     #iostat插件需要
|-- Regexp-Common-2010010201.tar.gz #iostat插件需要
|-- check_iostat                    #这就是上面提到iostat插件程序
|-- check_memory.pl                 #检测内存的插件程序
|-- check_mysql                     #检测MySQL插件程序
|-- libart_lgpl-2.3.17.tar.gz       #绘图相关依赖库
|-- nagios-3.5.1.tar.gz             #Nagios主程序
|-- nagios-plugins-1.4.16.tar.gz    #Nagios插件包
|-- nrpe-2.12.tar.gz                #客户端的守护进程,agent
|-- pnp-0.4.14.tar.gz               #绘图的Web界面软件
|-- rrdtool-1.2.14.tar.gz           #实际绘图软件,PNP调用

0 directories, 15 files
现在启动LAMP环境的HTTP服务:
[root@Nagios ~]# /etc/init.d/httpd start
Starting httpd: httpd: apr_sockaddr_info_get() failed for Nagios
#可忽略或者看后文解决方案
httpd: Could not reliably determine the servers fully qualified domain name, using 127.0.0.1 for ServerName
#可忽略或者看后文解决方案
                                                           [  OK  ]
[root@Nagios ~]# netstat -antup | grep 80
tcp        0      0 :::80                       :::*                        LISTEN      1780/httpd
上面的结果表明Nagios服务器端的LAMP环境是正常的。下面针对HTTP启动时的提示进行说明
提示一:“Starting httpd: httpd: apr_sockaddr_info_get() failed for Nagios”,表示这是hosts解析问题,在/etc/hosts中配好主机名和IP的解析就好了,配置结果如下:
[root@Nagios ~]# echo "`hostname -I` nagios-server" >> /etc/hosts
[root@Nagios ~]# tail -1 /etc/hosts
192.168.0.200 nagios-server提示二:“httpd: Could not reliably determine the servers fully qualified domain name, using 127.0.0.1 for ServerName”,这表示httpd.conf中缺少ServerName配置,可以在/etc/httpd/conf/httpd.conf中加入ServerName 127.0.0.1:80
[root@Nagios ~]# echo "ServerName 127.0.0.1:80" >> /etc/httpd/conf/httpd.conf 修改好了以后,我们再次重启httpd服务,如下:
[root@Nagios ~]# /etc/init.d/httpd restart
Stopping httpd:                                            [  OK  ]
Starting httpd:                                            [  OK  ]
3.2 安装Nagios服务器端
官方安装文档:http://nagios.sourceforge.net/docs/3_0/quickstart-fedora.html
[root@Nagios ~]# ls
anaconda-ks.cfg  install.log  install.log.syslog  nagios
[root@Nagios ~]# cd nagios/
[root@Nagios nagios]# ls -l nagios-3.5.1.tar.gz
-rw-r--r--. 1 root root 1763584 Aug 12 12:22 nagios-3.5.1.tar.gz
[root@Nagios nagios]# tar xf nagios-3.5.1.tar.gz -C /usr/src/
[root@Nagios nagios]# cd /usr/src/nagios/
[root@Nagios nagios]# ./configure --with-command-group=nagcmd

#省略开头,出现以下两句表示配置正确
#Review the options above for accuracy.  If they look okay,
#type 'make all' to compile the main program and CGIs.

[root@Nagios nagios]# make all

#省略开头,出现下面表示正确
#Enjoy.

[root@Nagios nagios]# make install

#省略开头,出现下面的话,表示正确结尾
#You can continue with installing Nagios as follows (type 'make'
#without any arguments for a list of all possible options):

#  make install-init
#     - This installs the init script in /etc/rc.d/init.d

#  make install-commandmode
#     - This installs and configures permissions on the
#       directory for holding the external command file

#  make install-config
#     - This installs sample config files in /usr/local/nagios/etc

#make[1]: Leaving directory `/usr/src/nagios'
提示:
如果是编译安装httpd,可以执行./configure --with-command-group=nagcmd --with-httpd-conf=/usr/local/apache/conf/extra 增加一个编译参数,即指定编译Nagios Web配置的生成路径
下面根据make install 命令执行后的提示继续操作
[root@Nagios nagios]# make install-init     #安装初始化脚本到/etc/rc.d/init.d
[root@Nagios nagios]# make install-config   #生成Nagios模板配置文件到/usr/local/nagios/etc
[root@Nagios nagios]# make install-commandmode  #安装配置目录许可外部命令文件
(1)安装Nagios Web配置文件及创建登录用户
接下来安装Nagios Web配置文件(生成Nagios对应于Apache里的配置文件)。
[root@Nagios nagios]# make install-webconf #生成/etc/httpd/conf.d/nagios.conf配置文件
/usr/bin/install -c -m 644 sample-config/httpd.conf /etc/httpd/conf.d/nagios.conf
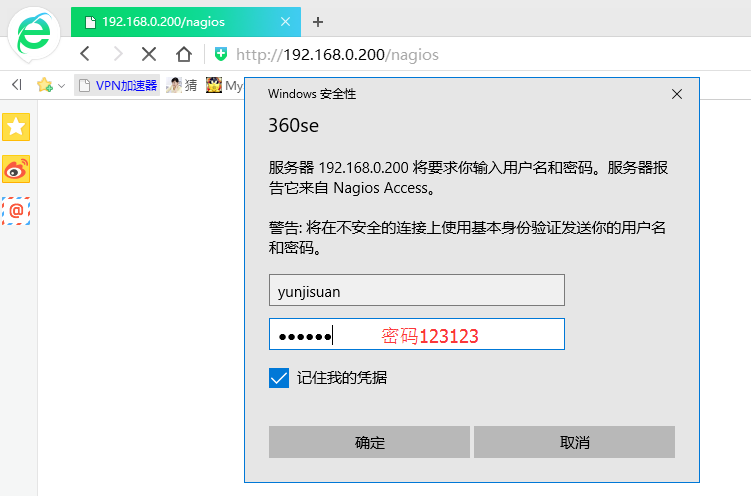
*** Nagios/Apache conf file installed ***创建Nagios Web监控界面后,登入时会需要用户名及密码,这里分别为yunjisuan和123123.
[root@Nagios nagios]# htpasswd -bc /usr/local/nagios/etc/htpasswd.users yunjisuan 123123
Adding password for user yunjisuan
[root@Nagios nagios]# cat /usr/local/nagios/etc/htpasswd.users
yunjisuan:XahUhj.D9ajcc
提示:
为什么要把密码生成到/usr/local/nagios/etc/htpasswd.users里呢?不能改路径吗?
这是因为/etc/httpd/conf.d/nagios.conf配置文件已经指定了htpasswd.user路径和文件名,如果想改可以先修改nagios.conf配置,但是没必要改,查看方式如下:
[root@Nagios nagios]# grep AuthUserFile /etc/httpd/conf.d/nagios.conf
   AuthUserFile /usr/local/nagios/etc/htpasswd.users
   AuthUserFile /usr/local/nagios/etc/htpasswd.users

#重新加载Apache服务:
[root@Nagios nagios]# /etc/init.d/httpd reload
Reloading httpd:
(2)添加监控报警信息接收的Email地址
快速修改方法如下:
[root@Nagios nagios]# sed -i 's#nagios@localhost#215379068@qq.com#g' /usr/local/nagios/etc/objects/contacts.cfg
[root@Nagios nagios]# sed -n '35p' /usr/local/nagios/etc/objects/contacts.cfg
        email                           215379068@qq.com    #这里是你的个人QQ不是,老师的QQ
常见的发送邮件方法有两种,一种是启动本机的邮件服务postfix。另外一种是使用网上第三方邮件服务商提供的服务,例如:QQ邮件服务或者网易邮件服务,如果是简单测试,推荐使用网易126或者163的smtp邮件发送服务地址配置。
第一种方法:监控服务器本地开启邮件服务。此功能依赖本机的服务。
[root@Nagios nagios]# /etc/init.d/postfix start
Starting postfix:                                          [  OK  ]
[root@Nagios nagios]# netstat -antup | grep 25
tcp        0      0 127.0.0.1:25                0.0.0.0:*                   LISTEN      6578/master
tcp        0      0 ::1:25                      :::*                        LISTEN      6578/master
[root@Nagios nagios]# chkconfig postfix on
[root@Nagios nagios]# chkconfig --list postfix
postfix         0:off   1:off   2:on    3:on    4:on    5:on    6:off
发送邮件测试:
[root@Nagios nagios]# echo "welcome to yunjisuan" | mail -s "test" 215379068@qq.com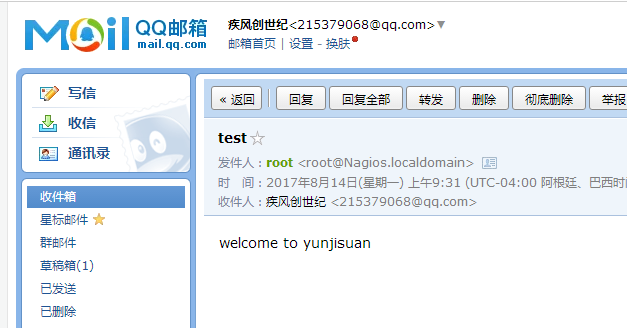
提示:
由于邮件服务没有做MX记录及反向解析,因此,所发邮件经常会收不到或者被当作垃圾邮件
第二种方法:使用第三方邮件服务商提供的邮箱。
#只需要修改/etc/mail.rc在最后增加如下两行内容即可:

set from=215379068@qq.com

smtp=smtp.qq.comset smtp-auth-user=215379068 smtp-auth-password=123123 smtp-auto=login
这个第三方服务选择QQ邮件服务或者网易邮件服务均可,这里选择了QQ邮件服务。
注意这里的215379068@qq.com是作为报警的发件人的,相当于使用215379068用户和1223123密码登陆QQ信箱,然后给人1发信,收件人就是在contact.cfg里定义的。
(3)配置启动Apache服务
下面启动Apache服务并加入系统开机自启动:
[root@Nagios nagios]# /etc/init.d/httpd start
Starting httpd:                                            [  OK  ]
[root@Nagios nagios]# chkconfig httpd on
[root@Nagios nagios]# chkconfig --list httpd
httpd           0:off   1:off   2:on    3:on    4:on    5:on    6:off
[root@Nagios nagios]# netstat -antup | grep 80
tcp        0      0 :::80                       :::*                        LISTEN      6670/httpd
此时,打开客户端计算机上的浏览器访问http://192.168.0.200/nagios会出现用户名和密码提示窗口,如下图所示:
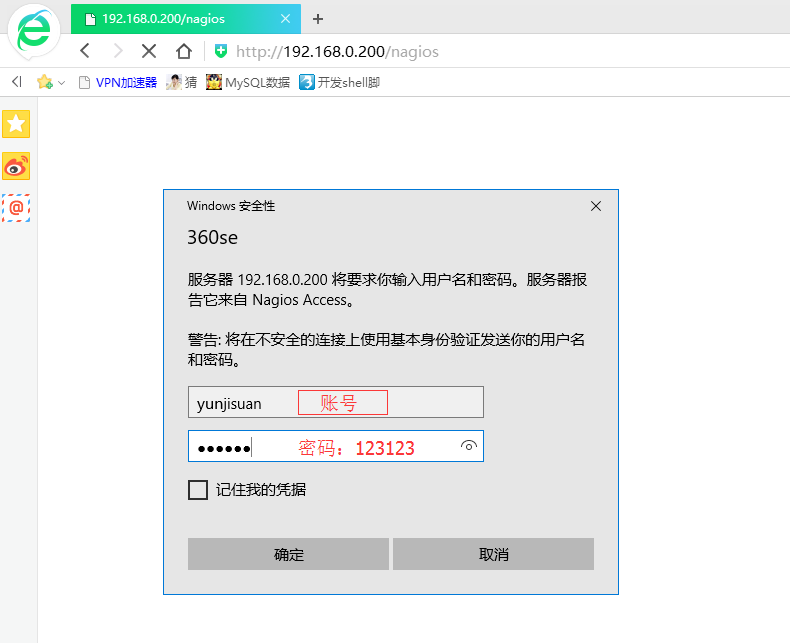
输入前面生成好的用户名和密码,也就是yunjisuan和123123
出现下图所示的界面表示Nagios及Nagios的Web环境已经正常了

(4)安装Nagios插件软件包
Nagios插件软件包就是一些实现获取数据信息的命令或程序,通过这些命令或程序,Nagios可以获取到需要的数据,然后1进行报警和展示。具体安装过程如下。
首先安装基础依赖包:
[root@Nagios nagios]# yum -y install perl-devel openssl-devel然后安装Nagios plugins插件包:
[root@Nagios nagios-plugins-1.4.16]# ./configure --with-nagios-user=nagios --with-nagios-group=nagios --enable-perl-modules --with-mysql
#如果一行放不下,可以通过反斜线换行输入。
[root@Nagios nagios-plugins-1.4.16]# make
[root@Nagios nagios-plugins-1.4.16]# make install
#此时检查插件个数:
[root@Nagios nagios-plugins-1.4.16]# ls /usr/local/nagios/libexec/ | wc -l
57              #多一个少一个都是正常的,不要太在意
(5)安装nrpe软件
可能有同学会问,nrpe是客户端需要安装的软件,为什么还要安装在Nagios服务器端?这是因为:
- Nagios服务器端需要check_nrpe插件做被动检查,如果服务器端不装nrpe软件,就没有check_nrpe这样的检查插件。
- Nagios服务器端本地的资源也需要被监控,因此,Nagios服务器端也会被作为客户端。
- nrpe软件的安装非常简单,就不多费笔墨了。安装nrpe软件的命令集如下:
[root@Nagios nagios]# ls -l nrpe-2.12.tar.gz
-rw-r--r--. 1 root root 405725 Aug 12 12:22 nrpe-2.12.tar.gz
[root@Nagios nagios]# tar xf nrpe-2.12.tar.gz -C /usr/src/
[root@Nagios nagios]# cd /usr/src/nrpe-2.12/
[root@Nagios nrpe-2.12]# ./configure
[root@Nagios nrpe-2.12]# make all
[root@Nagios nrpe-2.12]# make install-plugin
[root@Nagios nrpe-2.12]# make install-daemon
[root@Nagios nrpe-2.12]# make install-daemon-config
[root@Nagios ~]# ls /usr/local/nagios/libexec/check_nrpe
/usr/local/nagios/libexec/check_nrpe
[root@Nagios ~]# ls /usr/local/nagios/libexec/ | wc -l
58
#提示:生成nrpe的配置文件为/usr/local/nagios/etc/nrpe.cfg
到此为止,Nagios服务器端的软件安装部分就配置完了。
(6)配置并启动Nagios服务
#首先添加Nagios服务到开机自启动
[root@Nagios ~]# chkconfig nagios on
[root@Nagios ~]# chkconfig --list nagios
nagios          0:off   1:off   2:on    3:on    4:on    5:on    6:off

#更好的设置自动开机的方法是:
[root@Nagios ~]# echo "/etc/init.d/nagios start" >> /etc/rc.local
[root@Nagios ~]# tail -1 /etc/rc.local
/etc/init.d/nagios start

#然后验证Nagios配置文件(检查语法)
[root@Nagios ~]# /etc/init.d/nagios checkconfig
#此命令为检查语法的命令,但是只能报告对错无法给出错误的信息
Running configuration check... OK.

#可以使用命令行命令检查报错,并输出信息
[root@Nagios ~]# /usr/local/nagios/bin/nagios -v /usr/local/nagios/etc/nagios.cfg
省略...
Total Warnings: 0
Total Errors:   0

Things look okay - No serious problems were detected during the pre-flight check
#<==Total Warning 警告和Total Errors错误都为0,表示配置正常:
#<==Total Errors:如果不为0必须解决。否则Nagios无法启动。
#<==Total Warnings:这个如果不为0可以启动Nagios,可以不理睬。

#可以修改/etc/init.d/nagios实现上述命令行检查语法的详细输出,如下:
[root@Nagios ~]# /etc/init.d/nagios checkconfig
Running configuration check... OK.

#<==此命令默认情况只能判断错误或正确,并不显示错误的详细信息,如果想显示详细错误信息,需要做下简单的特殊处理,如下。
[root@Nagios ~]# grep 'checkconfig)' -n -A 2 /etc/init.d/nagios
181:    checkconfig)
182-        printf "Running configuration check..."
183-        $NagiosBin -v $NagiosCfgFile > /dev/null 2>&1;
#删除定向到空的内容,可让报错输出详细信息
删除上述脚本中的>/dev/null 2>$1;即可检查语法:
[root@Nagios ~]# /etc/init.d/nagios checkconfig
Running configuration check...
Nagios Core 3.5.1
Copyright (c) 2009-2011 Nagios Core Development Team and Community Contributors
Copyright (c) 1999-2009 Ethan Galstad
Last Modified: 08-30-2013
License: GPL

Website: http://www.nagios.org
Reading configuration data...
   Read main config file okay...
Processing object config file '/usr/local/nagios/etc/objects/commands.cfg'...
Processing object config file '/usr/local/nagios/etc/objects/contacts.cfg'...
Processing object config file '/usr/local/nagios/etc/objects/timeperiods.cfg'...
Processing object config file '/usr/local/nagios/etc/objects/templates.cfg'...
Processing object config file '/usr/local/nagios/etc/objects/localhost.cfg'...
   Read object config files okay...

Running pre-flight check on configuration data...

Checking services...
    Checked 8 services.
Checking hosts...
    Checked 1 hosts.
Checking host groups...
    Checked 1 host groups.
Checking service groups...
    Checked 0 service groups.
Checking contacts...
    Checked 1 contacts.
Checking contact groups...
    Checked 1 contact groups.
Checking service escalations...
    Checked 0 service escalations.
Checking service dependencies...
    Checked 0 service dependencies.
Checking host escalations...
    Checked 0 host escalations.
Checking host dependencies...
    Checked 0 host dependencies.
Checking commands...
    Checked 24 commands.
Checking time periods...
    Checked 5 time periods.
Checking for circular paths between hosts...
Checking for circular host and service dependencies...
Checking global event handlers...
Checking obsessive compulsive processor commands...
Checking misc settings...

Total Warnings: 0
Total Errors:   0

Things look okay - No serious problems were detected during the pre-flight check
 OK.
之后,启动Nagios服务,命令如下:
[root@Nagios ~]# /etc/init.d/nagios start
Starting nagios: done.
检查Nagios服务器端进程及端口
[root@Nagios ~]# ps -ef | grep nagios | grep -v grep
nagios    21663      1  0 07:48 ?        00:00:00 /usr/local/nagios/bin/nagios -d /usr/local/nagios/etc/nagios.cfg
#<==grep -v grep 表示排除自身的这个带grep命令的进程。

[root@Nagios ~]# netstat -antup | grep nagios   #没发现Nagios服务器端有端口
最后浏览Nagios Web界面检查。打开浏览器访问:http://服务器端ip/nagios会出现如下图所示提示:
如果访问页面打开报错,请关闭服务器端的iptables及selinux
至此,Nagios服务器端安装及配置就告一段落。
3.3 关于内网服务器的时间同步服务
在企业生产环境的内网环境中,一般是要有一台服务器专门和Internet上做时间同步,然后内网中的其他服务器都和这台服务器进行时间同步。
那么在我们本次的试验中,我们用Nagios服务器端和internet时间同步,同时所有被监控的客户端都和Nagios服务器端进行时间同步。
[root@Nagios ~]# yum -y install ntp ntpdate     #安装ntp时间同步服务端,ntpdate时间同步客户端
[root@Nagios ~]# crontab -l         #已经进行定时同步任务
#time sync by Mr.chen at 2017-08-12
*/5 * * * * /usr/sbin/ntpdate pool.ntp.org >/dev/null 2>&1
[root@Nagios ~]# /etc/init.d/ntpd start                 #启动ntpd服务端进程
Starting ntpd:                                             [  OK  ]
四,Nagios客户端安装
4.1 Nagios客户端安装说明
- Nagios客户端无需安装LAMP环境,也无需安装Nagios服务器端软件包,即nagios-3.5.1.tar.gz
- 与服务器端相比,Nagios客户端有一些额外的软件包需要安装,如下:
- Class-Accessor-0.31.tar.gz
- Config-Tiny-2.12.tar.gz
- Math-Calc-Units-1.0.7.tar.gz
- Nagios-Plugin-0.34.tar.gz
- Params-Validate-0.91.tar.gz
- Regexp-Common-2010010201.tar.gz
4.2 Nagios客户端安装准备
(1)准备2台服务器或VM虚拟机
| 管理IP地址 | 角色 | 备注 |
|---|---|---|
| 192.168.0.223 | Web01 | 被监控的客户端服务器 |
| 192.168.0.224 | Web02 | 被监控的客户端服务器 |
(2)环境准备与服务器端步骤相同
客户端的yum源安装,关闭Nagios Server端iptables防火墙及SElinux的方法,这里不再说明
以下操作再两台web上都进行
#nagios客户端向Nagios服务器端进行时间同步
[root@web01 ~]# yum -y install ntpdate              #安装时间同步客户端
[root@web01 ~]# ntpdate 192.168.0.200               #和Nagios服务器端进行时间同步
15 Aug 08:22:26 ntpdate[5242]: step time server 192.168.0.200 offset 1517558.308966 sec
[root@web01 ~]# date +%F
2017-08-15
[root@web01 ~]# echo "*/5 * * * * /usr/sbin/ntpdate 192.168.0.200 >/dev/null 2>&1" >> /var/spool/cron/root                 #写定时任务
[root@web01 ~]# cat /var/spool/cron/root
*/5 * * * * /usr/sbin/ntpdate 192.168.0.200 >/dev/null 2>&1
4.3 在Nagios客户端安装软件
(1)安装基础系统软件
命令如下:
[root@web01 nagios]# yum -y install gcc glibc glibc-common      #升级基础工具包
[root@web01 nagios]# yum -y install mysql-server        #安装这个目的为了Nagios plugins,生成check_mysql插件
(2)上传Nagios相关软件
#去掉不用的,客户端需要的软件,如下:
[root@web01 ~]# tree nagios/
nagios/
├── check_iostat
├── check_memory.pl
├── check_mysql
├── Class-Accessor-0.31.tar.gz
├── Config-Tiny-2.12.tar.gz
├── libart_lgpl-2.3.17.tar.gz
├── Math-Calc-Units-1.07.tar.gz
├── Nagios-Plugin-0.34.tar.gz
├── nagios-plugins-1.4.16.tar.gz
├── nrpe-2.12.tar.gz
├── Params-Validate-0.91.tar.gz
└── Regexp-Common-2010010201.tar.gz

0 directories, 12 files
(3)添加Nagios用户
添加方法如下:
[root@web01 ~]# useradd nagios -M -s /sbin/nologin
[root@web01 ~]# id nagios
uid=501(nagios) gid=501(nagios) groups=501(nagios)
(4)安装nagios-plugins插件
操作过程如下:
[root@web01 nagios]# yum -y install perl-devel perl-CPAN openssl-devel
[root@web01 nagios-plugins-1.4.16]# ./configure --with-nagios-user=nagios --with-nagios-group=nagios --enable-perl-modules --with-mysql
[root@web01 nagios-plugins-1.4.16]# make
[root@web01 nagios-plugins-1.4.16]# make install
此时插件的个数如下:
[root@web01 ~]# ls /usr/local/nagios/libexec/ | wc -l
57
(5)安装Nagios客户端nrpe软件
[root@web01 ~]# cd nagios/
[root@web01 nagios]# tar xf nrpe-2.12.tar.gz -C /usr/src/
[root@web01 nagios]# cd /usr/src/nrpe-2.12/
[root@web01 nrpe-2.12]# ./configure
[root@web01 nrpe-2.12]# make all
[root@web01 nrpe-2.12]# make install-plugin
[root@web01 nrpe-2.12]# make install-daemon
#生成nrpe.cfg
[root@web01 nrpe-2.12]# make install-daemon-config
(6)安装其他相关的插件
以下是check_iostat插件需要的依赖包,非必须安装,如果不使用软件包里提供的check_iostat可以不装,虽然命令集很多,但是安装简单,因此可以批量执行这些命令。
#安装Params-Validate-0.91.tar.gz软件包
[root@web01 ~]# cd nagios/
[root@web01 nagios]# tar xf Params-Validate-0.91.tar.gz -C /usr/src/
[root@web01 nagios]# cd /usr/src/Params-Validate-0.91/
[root@web01 Params-Validate-0.91]# perl Makefile.PL
[root@web01 Params-Validate-0.91]# make
[root@web01 Params-Validate-0.91]# make install

#安装Class-Accessor-0.31.tar.gz软件包
[root@web01 ~]# cd nagios/
[root@web01 nagios]# tar xf Class-Accessor-0.31.tar.gz -C /usr/src/
[root@web01 nagios]# cd /usr/src/Class-Accessor-0.31/
[root@web01 Class-Accessor-0.31]# perl Makefile.PL
[root@web01 Class-Accessor-0.31]# make && make install

#安装Config-Tiny-2.12.tar.gz软件包
[root@web01 ~]# cd nagios/
[root@web01 nagios]# tar xf Config-Tiny-2.12.tar.gz -C /usr/src/
[root@web01 nagios]# cd /usr/src/Config-Tiny-2.12/
[root@web01 Config-Tiny-2.12]# perl Makefile.PL
[root@web01 Config-Tiny-2.12]# make && make install

#安装Math-Calc-Units-1.07.tar.gz软件包
[root@web01 ~]# cd nagios/
[root@web01 nagios]# tar xf Math-Calc-Units-1.07.tar.gz -C /usr/src/
[root@web01 nagios]# cd /usr/src/Math-Calc-Units-1.07/
[root@web01 Math-Calc-Units-1.07]# perl Makefile.PL
[root@web01 Math-Calc-Units-1.07]# make && make install

#安装Regexp-Common-2010010201.tar.gz软件包
[root@web01 ~]# cd nagios/
[root@web01 nagios]# tar xf Regexp-Common-2010010201.tar.gz -C /usr/src/
[root@web01 nagios]# cd /usr/src/Regexp-Common-2010010201/
[root@web01 Regexp-Common-2010010201]# perl Makefile.PL
[root@web01 Regexp-Common-2010010201]# make && make install

#安装Nagios-Plugin-0.34.tar.gz软件包
[root@web01 ~]# cd nagios/
[root@web01 nagios]# tar xf Nagios-Plugin-0.34.tar.gz -C /usr/src/
[root@web01 nagios]# cd /usr/src/Nagios-Plugin-0.34/
[root@web01 Nagios-Plugin-0.34]# perl Makefile.PL
[root@web01 Nagios-Plugin-0.34]# make && make install
安装sysstat系统性能分析工具,监控系统性能时程序或脚本会调用这些工具
[root@web02 ~]# yum -y install sysstat              #光盘安装即可
[root@web02 ~]# rpm -q sysstat
sysstat-9.0.4-22.el6.x86_64
提示:
sysstat工具包中包含两类工具,分别为即时查看工具(iostat,mpstat,sar)和累计统计工具(sar)。可以看出,这两类工具中都有sar,也就是说,sar具有这两种功能。可见,sar是sysstat中的核心工具。为了实现sar的累计统计功能,系统必须周期性地记录当时的信息,这是通过调用/usr/lib/sa/中的三个工具实现的:
- sa1:收集并存储每天的系统动态信息到一个二进制的文件中,用作sadc的前端程序。
- sa2:收集每天的系统活跃信息写入总结性的报告,用作sar的1前端程序。
- sadc:系统动态数据收集工具,收集的数据被写入一个二进制的文件中,用作sar工具的后端程序。
这里针对监视物理组件的高级Linux命令小结如下:
内存:top,free,vmstat,mpstat,iostat,sar
CPU:top,vmstat,mpstat,iostat,sar
I/O:vmstat,mpstat,iostat,sar
进程:ipcs,ipcrm
负载:uptime
(7)配置监控内存,磁盘I/O脚本插件
批量部署命令如下:
[root@web01 ~]# yum -y install dos2unix             #光盘安装即可
[root@web01 ~]# /bin/cp /root/nagios/check_memory.pl /usr/local/nagios/libexec/
[root@web01 ~]# /bin/cp /root/nagios/check_iostat /usr/local/nagios/libexec/
#<===以上两个命令是将事先写好的脚本(check_memory.pl和check_iostat)放到Nagios脚本目录下。

[root@web01 ~]# chmod 755 /usr/local/nagios/libexec/check_memory.pl
[root@web01 ~]# chmod 755 /usr/local/nagios/libexec/check_iostat
#以上两条命令是授权让脚本可执行
[root@web01 ~]# dos2unix /usr/local/nagios/libexec/check_memory.pl
dos2unix: converting file /usr/local/nagios/libexec/check_memory.pl to UNIX format ...
[root@web01 ~]# dos2unix /usr/local/nagios/libexec/check_iostat
dos2unix: converting file /usr/local/nagios/libexec/check_iostat to UNIX format ...
#<==使用dos2UNIX使之格式为UNIX的脚本格式,否则执行可能出错。

#注意:
#这个路径是上传的软件包所在路径/root/nagios
4.4 配置Nagios客户端nrpe服务
可通过以下命令配置客户端的nrpe.cfg
#加入Nagios Server服务端的IP,用以监控当前Client
[root@web01 ~]# cd /usr/local/nagios/etc
[root@web01 etc]# ls -l nrpe.cfg
-rw-r--r--. 1 nagios nagios 7207 Aug 15 09:07 nrpe.cfg
[root@web01 etc]# sed -n '79p' nrpe.cfg
allowed_hosts=127.0.0.1
[root@web01 etc]# sed -i '79 s#$#,192.168.0.200#g' nrpe.cfg
[root@web01 etc]# sed -n '79p' nrpe.cfg
allowed_hosts=127.0.0.1,192.168.0.200

#提示:
#新加入的192.168.0.200是服务端IP不是客户端的
#大于500台机器做集群或分布式监控时,可以使用多个Nagios Server,IP要用逗号隔开
注释掉nrpe.cfg的199~203行内容
[root@web01 etc]# sed -n '199,203p' nrpe.cfg
command[check_users]=/usr/local/nagios/libexec/check_users -w 5 -c 10
command[check_load]=/usr/local/nagios/libexec/check_load -w 15,10,5 -c 30,25,20
command[check_hda1]=/usr/local/nagios/libexec/check_disk -w 20% -c 10% -p /dev/hda1
command[check_zombie_procs]=/usr/local/nagios/libexec/check_procs -w 5 -c 10 -s Z
command[check_total_procs]=/usr/local/nagios/libexec/check_procs -w 150 -c 200
[root@web01 etc]# sed -i '199,203 s/^/#/' nrpe.cfg
[root@web01 etc]# sed -n '199,203p' nrpe.cfg
#command[check_users]=/usr/local/nagios/libexec/check_users -w 5 -c 10
#command[check_load]=/usr/local/nagios/libexec/check_load -w 15,10,5 -c 30,25,20
#command[check_hda1]=/usr/local/nagios/libexec/check_disk -w 20% -c 10% -p /dev/hda1
#command[check_zombie_procs]=/usr/local/nagios/libexec/check_procs -w 5 -c 10 -s Z
#command[check_total_procs]=/usr/local/nagios/libexec/check_procs -w 150 -c 200
在配置文件nrpe.cfg下面添加要监控的内容:
#在文件最后添加以下5行内容
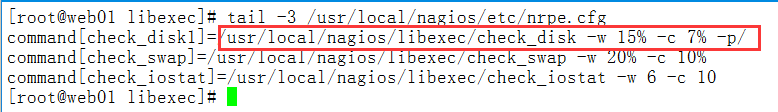
[root@web01 etc]# tail -5 /usr/local/nagios/etc/nrpe.cfg
command[check_load]=/usr/local/nagios/libexec/check_load -w 15,10,5 -c 30,25,20
command[check_mem]=/usr/local/nagios/libexec/check_memory.pl -w 10% -c 3%
command[check_disk]=/usr/local/nagios/libexec/check_disk -w 15% -c 7% -p/
command[check_swap]=/usr/local/nagios/libexec/check_swap -w 20% -c 10%
command[check_iostat]=/usr/local/nagios/libexec/check_iostat -w 6 -c 10上面依次为对负载,内存,硬盘,虚拟内存,磁盘I/O进行监控,这些都是本地的服务(我们一般通过nrpe去客户端执行脚本插件获取信息,这样的模式称为被动监控,与nsca的客户端主动提交结果不冲突),由Nagios服务器端通过nrpe插件定时在client的nrpe服务上获取信息。
之后,启动Nagios client nrpe守护进程
[root@web01 etc]# /usr/local/nagios/bin/nrpe -c /usr/local/nagios/etc/nrpe.cfg -d
[root@web01 etc]# netstat -antup | grep nrpe
tcp        0      0 0.0.0.0:5666                0.0.0.0:*                   LISTEN      21041/nrpe
此时,可以将nrpe加入开机自启动了,命令如下:
[root@web01 etc]# echo "#nagios nrpe process cmd by Mr.chen 2017-8-15" >> /etc/rc.local
[root@web01 etc]# echo "/usr/local/nagios/bin/nrpe -c /usr/local/nagios/etc/nrpe.cfg -d" >> /etc/rc.local
[root@web01 etc]# tail -2 /etc/rc.local
#nagios nrpe process cmd by Mr.chen 2017-8-15
/usr/local/nagios/bin/nrpe -c /usr/local/nagios/etc/nrpe.cfg -d
重要提醒:
客户端的nrpe.cfg配置文件,最好保留一份到计算机上,这样以后在其他机器上装nrpe时,直接上传即可,就省得费劲修改了。
五,Nagios服务器端监控
5.1 Nagios服务器端监控基础介绍
(1)Nagios服务器端目录结构
Nagios服务器端安装后的目录结构如下:
[root@Nagios ~]# ls -l /usr/local/nagios/
total 32
drwxrwxr-x.  2 nagios nagios 4096 Aug 14 10:32 bin
drwxrwxr-x.  3 nagios nagios 4096 Aug 14 10:33 etc
drwxr-xr-x.  2 root   root   4096 Aug 14 10:11 include
drwxrwxr-x.  2 nagios nagios 4096 Aug 14 10:32 libexec
drwxr-xr-x.  5 root   root   4096 Aug 14 10:11 perl
drwxrwxr-x.  2 nagios nagios 4096 Aug 14 07:36 sbin
drwxrwxr-x. 11 nagios nagios 4096 Aug 14 10:11 share
drwxrwxr-x.  5 nagios nagios 4096 Aug 15 11:11 var
具体含义请参考以下图片:
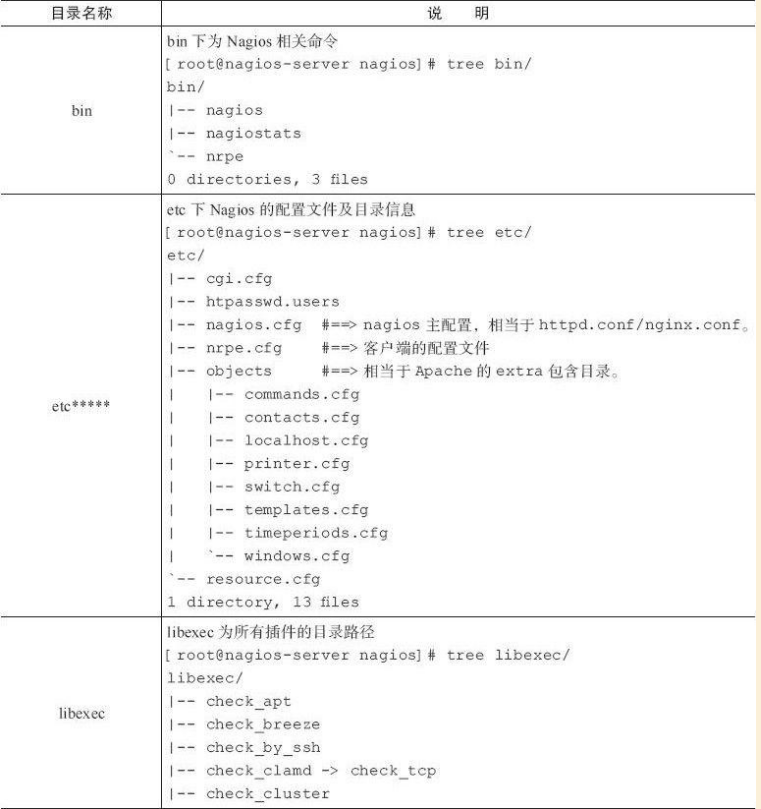
所有客户端本地服务的监控都是通过执行libexec目录下的插件来实现的,当然,如果开启了snmp,Nagios服务器端也可以主动抓取。
(2)Nagios服务器端核心配置文件
Nagios主配置文件为nagios.cfg,默认在/usr/local/nagios/etc目录下,/usr/local/nagios/etc目录下有个objects(类似Apache的extra)目录,里面放的是组配置文件nagios.cfg包含的其他Nagios配置文件。查看命令如下:
[root@Nagios ~]# tree /usr/local/nagios/etc/
/usr/local/nagios/etc/
|-- cgi.cfg
|-- htpasswd.users
|-- nagios.cfg
|-- nrpe.cfg
|-- objects
|   |-- commands.cfg
|   |-- contacts.cfg
|   |-- localhost.cfg
|   |-- printer.cfg
|   |-- switch.cfg
|   |-- templates.cfg
|   |-- timeperiods.cfg
|   `-- windows.cfg
`-- resource.cfg

1 directory, 13 files
[root@Nagios ~]# tail -10 /usr/local/nagios/etc/resource.cfg
# Sets $USER1$ to be the path to the plugins
$USER1$=/usr/local/nagios/libexec

# Sets $USER2$ to be the path to event handlers
#$USER2$=/usr/local/nagios/libexec/eventhandlers

# Store some usernames and passwords (hidden from the CGIs)
#$USER3$=someuser
#$USER4$=somepassword
[root@Nagios ~]# tree /usr/local/nagios/etc/objects/
/usr/local/nagios/etc/objects/
|-- commands.cfg
|-- contacts.cfg
|-- localhost.cfg
|-- printer.cfg
|-- switch.cfg
|-- templates.cfg
|-- timeperiods.cfg
`-- windows.cfg

0 directories, 8 files
在nagios.cfg中既可以指定单独包含一个cfg文件,也可以指定包含一个目录,即1该目录下所有的cfg文件都会包含进来。
为了让目录结构看起来更清晰,以及批量部署服务的需要,我们把主配置文件包含的配置文件修改为下表的形式。
(3)配置主配置文件nagios.cfg
#首先,在nagios.cfg文件中找到cfg_file部分,进行如下设置:
[root@Nagios ~]# sed -n '34,36p' /usr/local/nagios/etc/nagios.cfg
#增加如下主机和服务的配置文件
cfg_file=/usr/local/nagios/etc/objects/hosts.cfg
cfg_file=/usr/local/nagios/etc/objects/services.cfg
cfg_dir=/usr/local/nagios/etc/objects/services

#这是为备用增加的一个service目录,初学者可以忽略此行,使用目录的优点很多,在目录下的文件只要符合*.cfg就可以被Nagios加载。使用脚本批量部署时可非常方便地随机命名配置文件
#然后在配置文件里注释掉如下一行
[root@Nagios ~]# sed -n '37,38p' /usr/local/nagios/etc/nagios.cfg
# Definitions for monitoring the local (Linux) host
#cfg_file=/usr/local/nagios/etc/objects/localhost.cfg           #注释本行

#<==localhost.cfg这个配置为监控Nagios服务器端本地服务的配置文件,注释掉它,然后统一监控
操作完毕,保存nagios.cfg。接着,根据已有数据生成hosts.cfg主机文件,命令集如下:
[root@Nagios ~]# cd /usr/local/nagios/etc/objects/
[root@Nagios objects]# head -51 localhost.cfg > hosts.cfg
[root@Nagios objects]# chown nagios.nagios /usr/local/nagios/etc/objects/hosts.cfg
然后生成新的空的services.cfg服务文件,操作过程如下:
[root@Nagios objects]# touch services.cfg
[root@Nagios objects]# chown -R nagios.nagios services.cfg
**最后,生成服务的配置文件目录,所有放到此目录下的配置(*.cfg)都会自动被包含到主配置文件中生效。操作过程如下:**
[root@Nagios objects]# mkdir services
[root@Nagios objects]# chown -R nagios.nagios services
[root@Nagios objects]# ls -lrt
total 56
-rw-rw-r--. 1 nagios nagios 10812 Aug 14 07:46 templates.cfg
-rw-rw-r--. 1 nagios nagios  7716 Aug 14 07:46 commands.cfg
-rw-rw-r--. 1 nagios nagios  3208 Aug 14 07:46 timeperiods.cfg
-rw-rw-r--. 1 nagios nagios  5403 Aug 14 07:46 localhost.cfg
-rw-rw-r--. 1 nagios nagios  4019 Aug 14 07:46 windows.cfg
-rw-rw-r--. 1 nagios nagios  3124 Aug 14 07:46 printer.cfg
-rw-rw-r--. 1 nagios nagios  3293 Aug 14 07:46 switch.cfg
-rw-rw-r--. 1 nagios nagios  2166 Aug 14 09:15 contacts.cfg
-rw-r--r--. 1 nagios nagios  1870 Aug 15 11:49 hosts.cfg
-rw-r--r--. 1 nagios nagios     0 Aug 15 13:00 services.cfg
drwxr-xr-x. 2 nagios nagios  4096 Aug 15 13:02 services
(4)Nagios监控模式定义及监控模式选择
根据监控的行为,将Nagios的监控分为主动监控和被动监控(即nrpe半被动和nsca全被动),nsca全被动暂不详述,下面先来看看什么是主动监控和半被动监控。
- 主动监控:把像URL监控一样由Nagios服务器端发出请求的主动探测监控方式,定义为主动监控方式,也就是说不需要在客户端安装任何插件。当然,主动监控模式也可以配置成被动模式。
- (半)被动监控:由Nagios服务器端通过nrpe插件定时去连接client的nrpe服务获取信息,并发回到Nagios服务器端的监控称之为半被动监控,这类监控通常是针对本地资源的,比如负载,内存,硬盘,虚拟内存,磁盘I/O,温度,风扇转速等,而非系统对外提供的服务,只要安装了类似nrpe的插件方式的监控,都认为是半被动监控。
如何选择主动监控模式和(半)被动监控模式?
1)对于本地的资源性能,一般用被动监控模式(NRPE)。例如,对负载,内存,硬盘,虚拟内存,磁盘I/O,温度,风扇等的监控(我们也可以通过snmp实现监控部分系统资源)。
2)对于Web服务,数据库服务这种能对外提供服务的,一般用主动模式,例如:监控httpd,sshd,mysqld,rsyncd等服务。
主动模式和被动模式是相对的,并且是可以互相转换的,即主动模式的服务,可以改成被动模式的,被动模式的服务有时也可以改为主动模式的。
提示:
我们在后面把nrpe的监控统称为被动监控模式
5.2 配置Nagios服务器端监控项
(1)定义要监控的Nagios客户端主机
hosts.cfg一般用来存放Nagios要监控的主机相关配置,下面是hosts.cfg中的主机定义部分的配置参数详解。
#精简hosts.cfg配置模板
[root@Nagios objects]# cp hosts.cfg{,.bak}
[root@Nagios objects]# egrep -v "^$|#" hosts.cfg.bak > hosts.cfg

#将hosts.cfg里的内容修改成以下状态。
[root@Nagios objects]# cat hosts.cfg
# Define a host for the local machine
define host{                #<==define host为关键字,意思是定义主机,主机内容用一对大括号括起来
        use                     linux-server     #定义主机使用的模板,具体参见templates.cfg
        host_name               web01            #直接定义主机名称,根据服务功能可随意定义
        alias                   web01            #直接定义主机别名,同上
        address                 192.168.0.223    #直接定义被监控服务器的IP
        }
define host{
        use                     linux-server
        host_name               web02
        alias                   web02
        address                 192.168.0.224
        }

define hostgroup{
        hostgroup_name  linux-servers
        alias           Linux Servers
        members         web01,web02             #把前面定义的每一个Nagios客户端主机名在这里用逗号隔开列出来
        }
(2)配置services.cfg,定义要监控的资源服务
services.cfg文件是配置监控服务的,是Nagios最重要的配置文件之一,如果服务器数量比较少(50台以内),则需要监控的大部分服务配置都可以在这里面添加。这个配置文件默认是不存在的,需要人为定义。
先来看看services.cfg配置文件的service配置参数,详细说明如下:
[root@Nagios objects]# cat services.cfg

define service {                                #磁盘分区监控(被动监控)
    use generic-service
    host_name web01
    service_description Disk Partition
    check_command check_nrpe!check_disk
}
define service {                                #swap监控(被动监控)
    use generic-service
    host_name web01
    service_description Swap Useage
    check_command check_nrpe!check_swap
}
define service {                                #内存监控(被动监控)
    use generic-service
    host_name web01
    service_description MEM Useage
    check_command check_nrpe!check_mem
}
define service {                                #系统负载监控(被动监控)
    use generic-service
    host_name web01
    service_description Current Load
    check_command check_nrpe!check_load
}
define service {                                #磁盘I/O监控(被动监控)
    use generic-service
    host_name web01
    service_description Disk lostat
    check_command check_nrpe!check_iostat!5!11
}
define service {                                #ping监控(主动监控)
    use generic-service
    host_name web01
    service_description PING
    check_command check_ping!100.0,20%!500.0,60%
}
提示:
(1)上述配置中的check_nrpe是服务器端的插件(是commands.cfg里预先定义的命令名),负责和客户端的nrpe进程交流并执行check_nrpe叹号后的插件,所以,check_nrpe ! check_load配置中的check_load是客户端的插件名,是在与客户端的nrpe进程对应的配置nrpe.cfg里定义的命令名。
(2)以上services.cfg中添加了对磁盘分区,Load,Mem,Swap,磁盘I/O,ping的监控。
Nagios软件默认没有提供客户端的内存和I/O插件,但本文在配置时已经复制进去了,因此,只需在commands.cfg里配置即可,详细请同学们看后面的commands.cfg说明
(3)调试hosts.cfg和service.cfg的所有配置
[root@Nagios objects]# /etc/init.d/nagios checkconfig
Running configuration check...
Nagios Core 3.5.1
Copyright (c) 2009-2011 Nagios Core Development Team and Community Contributors
Copyright (c) 1999-2009 Ethan Galstad
Last Modified: 08-30-2013
License: GPL

Website: http://www.nagios.org
Reading configuration data...
   Read main config file okay...
Processing object config file '/usr/local/nagios/etc/objects/commands.cfg'...
Processing object config file '/usr/local/nagios/etc/objects/contacts.cfg'...
Processing object config file '/usr/local/nagios/etc/objects/timeperiods.cfg'...
Processing object config file '/usr/local/nagios/etc/objects/templates.cfg'...
Processing object config file '/usr/local/nagios/etc/objects/hosts.cfg'...
Processing object config file '/usr/local/nagios/etc/objects/services.cfg'...
Processing object config directory '/usr/local/nagios/etc/objects/services'...
   Read object config files okay...

Running pre-flight check on configuration data...

Checking services...
Error: Service check command 'check_nrpe ' specified in service 'Current Load' for host 'web01' not defined anywhere!
Error: Service check command 'check_nrpe ' specified in service 'Disk Partition' for host 'web01' not defined anywhere!
Error: Service check command 'check_nrpe ' specified in service 'Disk lostat' for host 'web01' not defined anywhere!
Error: Service check command 'check_nrpe ' specified in service 'MEM Useage' for host 'web01' not defined anywhere!
Error: Service check command 'check_nrpe ' specified in service 'PING' for host 'web01' not defined anywhere!
Error: Service check command 'check_nrpe ' specified in service 'Swap Useage' for host 'web01' not defined anywhere!
Error: Service check command 'check_nrpe ' specified in service 'Current Load' for host 'web02' not defined anywhere!
Error: Service check command 'check_nrpe ' specified in service 'Disk Partition' for host 'web02' not defined anywhere!
Error: Service check command 'check_nrpe ' specified in service 'Disk lostat' for host 'web02' not defined anywhere!
Error: Service check command 'check_nrpe ' specified in service 'MEM Useage' for host 'web02' not defined anywhere!
Error: Service check command 'check_nrpe ' specified in service 'PING' for host 'web02' not defined anywhere!
Error: Service check command 'check_nrpe ' specified in service 'Swap Useage' for host 'web02' not defined anywhere!
    Checked 12 services.
Checking hosts...
    Checked 2 hosts.
Checking host groups...
    Checked 1 host groups.
Checking service groups...
    Checked 0 service groups.
Checking contacts...
    Checked 1 contacts.
Checking contact groups...
    Checked 1 contact groups.
Checking service escalations...
    Checked 0 service escalations.
Checking service dependencies...
    Checked 0 service dependencies.
Checking host escalations...
    Checked 0 host escalations.
Checking host dependencies...
    Checked 0 host dependencies.
Checking commands...
    Checked 24 commands.
Checking time periods...
    Checked 5 time periods.
Checking for circular paths between hosts...
Checking for circular host and service dependencies...
Checking global event handlers...
Checking obsessive compulsive processor commands...
Checking misc settings...

Total Warnings: 0
Total Errors:   12

***> One or more problems was encountered while running the pre-flight check...

     Check your configuration file(s) to ensure that they contain valid
     directives and data defintions.  If you are upgrading from a previous
     version of Nagios, you should be aware that some variables/definitions
     may have been removed or modified in this version.  Make sure to read
     the HTML documentation regarding the config files, as well as the
     'Whats New' section to find out what has changed.

 CONFIG ERROR!  Check your Nagios configuration.
根据错误提示,我们可以知道,是check_nrpe插件没有定义导致的。来看一下解决方法。
首先,需要在commands.cfg中加入check_nrpe的插件配置.
[root@Nagios objects]# tail -8 commands.cfg
#'check_nrpe'command definition

define command{

    command_name check_nrpe
    command_line $USER1$/check_nrpe -H $HOSTADDRESS$ -c $ARG1$

}
此时重新执行检查语法的命令:
[root@Nagios objects]# /etc/init.d/nagios checkconfig
#中间过程略
Checking misc settings...

Total Warnings: 0
Total Errors:   0

Things look okay - No serious problems were detected during the pre-flight check
 OK.
此时,警告和错误都为0,则表示已经OK了,一般来讲警告可以忽略,错误必须要解决掉,否则,无法继续,调试完成后启动Nagios服务。
[root@Nagios objects]# /etc/init.d/nagios start
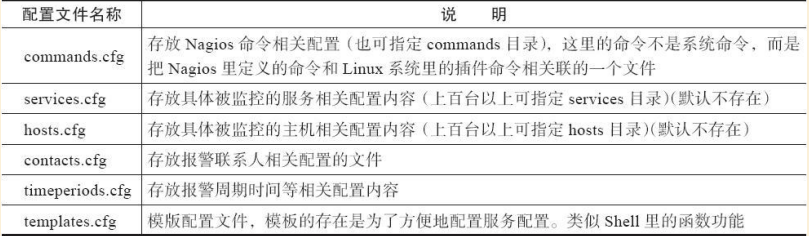
Starting nagios: done.如果启动成功的话,那么此时就可以登陆192.168.0.200/nagios。查看本地各系统状态的监控成果了。但是如果出现如下错误提示。
这个错误表示登陆Web端的用户yunjisuan没有被许可查看这些服务资源,可按照如下方法解决上面问题。
[root@Nagios objects]# cd /usr/local/nagios/etc/
[root@Nagios etc]# egrep -n "^authorized_for" cgi.cfg
authorized_for_system_information=nagiosadmin
authorized_for_configuration_information=nagiosadmin
authorized_for_system_commands=nagiosadmin
authorized_for_all_services=nagiosadmin
authorized_for_all_hosts=nagiosadmin
authorized_for_all_service_commands=nagiosadmin
authorized_for_all_host_commands=nagiosadmin
上述authorized开头的行对应的都是不同权限,可以看出,在结尾的许可处用过户都是nagiosadmin。此时,把在前面建立的Nagios Web登陆用户yunjisuan加到每一个许可项的后面,注意两者用逗号隔开。
[root@Nagios etc]# sed -i 's#nagiosadmin#yunjisuan#g' cgi.cfg
[root@Nagios etc]# egrep -n "^authorized_for" cgi.cfg
119:authorized_for_system_information=yunjisuan
131:authorized_for_configuration_information=yunjisuan
144:authorized_for_system_commands=yunjisuan
157:authorized_for_all_services=yunjisuan
158:authorized_for_all_hosts=yunjisuan
171:authorized_for_all_service_commands=yunjisuan
172:authorized_for_all_host_commands=yunjisuan
提示:
1)理想情况最好换掉默认管理员用户nagiosadmin,替换成自己的yunjisuan等,然后根据需求加适合自己的权限,比如,给别人看只给浏览权限就可以了。具体见cgi.cfg
2)遇到调试问题注意查看/usr/local/nagios/var/nagios.log,这点很重要。高手都这么做
现在,重新加载配置使得修改生效
[root@Nagios etc]# /etc/init.d/nagios reload
Running configuration check...done.
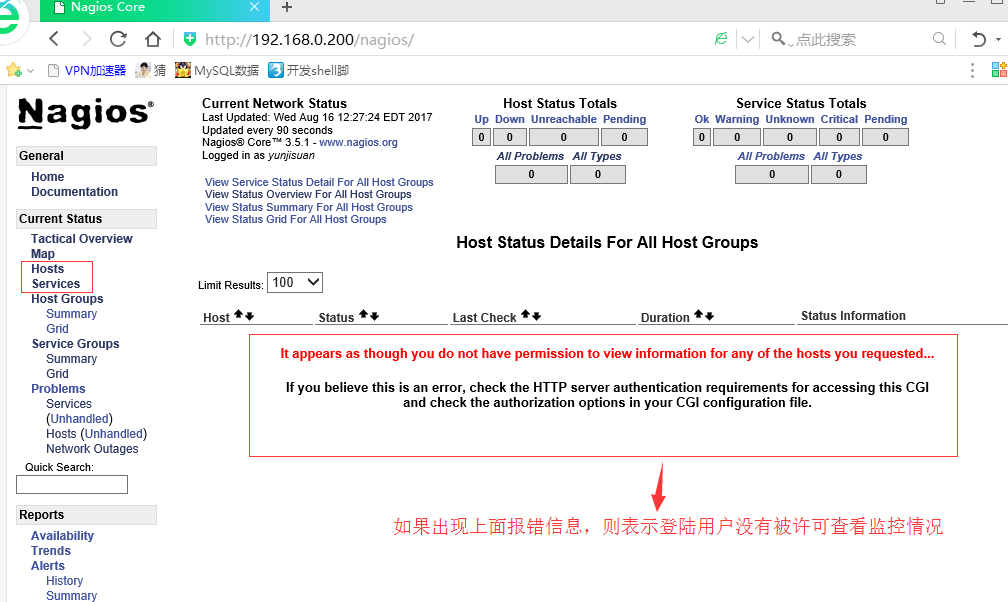
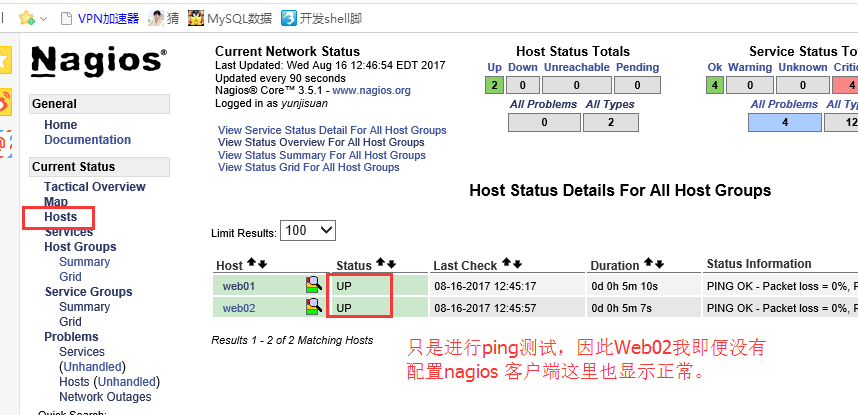
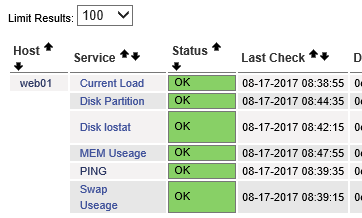
Reloading nagios configuration...done正常监控后的效果图,如下:
提示:UP代表服务器正常
服务器监控效果图,刚配置完的主机监控图如下:
(4)被动模式下基于Nagios监控原理排错的案例
还记得之前的nrpe原理图吗?来回顾一下,见下图:
Nagios被动模式的监控原理离不开check_nrpe这个插件,也就是说其实是利用下面这个命令工作的:
/usr/local/nagios/libexec/check_nrpe -H 192.168.0.223 -c check_mem下面看两个模拟Nagios配置错误的案例
第一个案例模拟:取消Web节点被监控端的check_memory.pl脚本的执行权限,摸你前面的错误。
#在Web端执行操作
[root@web01 ~]# cd /usr/local/nagios/libexec/
[root@web01 libexec]# chmod a-x check_memory.pl
[root@web01 libexec]# ll check_memory.pl
-rw-r--r--. 1 root root 4670 Aug 15 10:26 check_memory.pl
稍等一下或重启Nagios后,此时页面内存服务监控行出现错误提示。
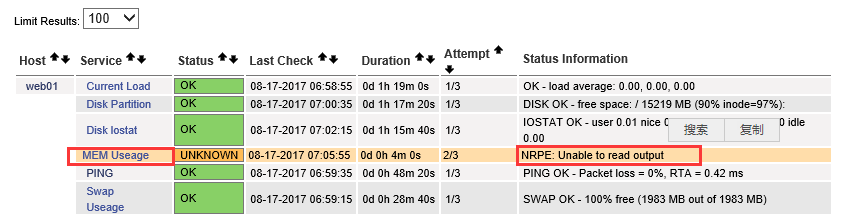
错误提示为:NRPE:Unable to read output
第二个案例模拟:把Web被监控端的nrpe.cfg中的命令名写错,如下:
[root@web01 libexec]# tail -3 /usr/local/nagios/etc/nrpe.cfg
command[check_disk]=/usr/local/nagios/libexec/check_disk -w 15% -c 7% -p/
command[check_swap]=/usr/local/nagios/libexec/check_swap -w 20% -c 10%
command[check_iostat]=/usr/local/nagios/libexec/check_iostat -w 6 -c 10
[root@web01 libexec]# vim /usr/local/nagios/etc/nrpe.cfg
[root@web01 libexec]# tail -3 /usr/local/nagios/etc/nrpe.cfg
command[check_disk1]=/usr/local/nagios/libexec/check_disk -w 15% -c 7% -p/
command[check_swap]=/usr/local/nagios/libexec/check_swap -w 20% -c 10%
command[check_iostat]=/usr/local/nagios/libexec/check_iostat -w 6 -c 10

#提示:
#把command[check_disk]写成command[check_disk1]
重启Web被监控端nrpe服务后,此时页面磁盘服务监控行出现如下错误提示:
[root@web01 libexec]# pkill nrpe
[root@web01 libexec]# netstat -antup | grep nrpe
[root@web01 libexec]# /usr/local/nagios/bin/nrpe -c /usr/local/nagios/etc/nrpe.cfg -d
[root@web01 libexec]# netstat -antup | grep nrpe
tcp 0 0 0.0.0.0:5666 0.0.0.0:* LISTEN 22084/nrpe 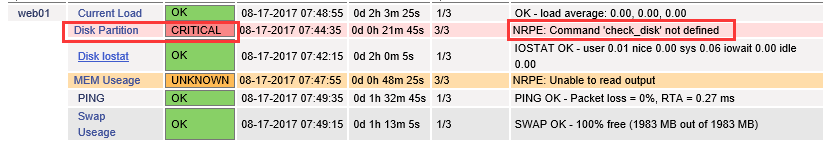
错误提示为:NRPE:Command ‘check_disk’ not defined
下面就针对上面两个案例进行故障排查
案例1:NRPE:Unable to read output 排查
1)在Nagios服务器端执行如下命令:
[root@Nagios ~]# /usr/local/nagios/libexec/check_nrpe -H 192.168.0.223 -c check_mem
NRPE: Unable to read output
2)在客户端本地执行命令脚本检查(就是command[check_mem]=后面对应的脚本)
[root@web01 libexec]# /usr/local/nagios/libexec/check_memory.pl -w 10% -c 3%
#这个命令最好是复制nrpe.cfg里的配置,不要手敲,防止出错
-bash: /usr/local/nagios/libexec/check_memory.pl: Permission denied

#提示拒绝,所以,原因就找到了。因为check_memory.pl脚本无执行权限导致的NRPE:Unalbe to read output错误。

[root@web01 libexec]# chmod a+x /usr/local/nagios/libexec/check_memory.pl
[root@web01 libexec]# /usr/local/nagios/libexec/check_memory.pl -w 10% -c 3%
CHECK_MEMORY OK - 845M free | free=886231040b;102851788.8:;30855536.64:
3)此时在Nagios服务器端执行如下命令:
[root@Nagios ~]# /usr/local/nagios/libexec/check_nrpe -H 192.168.0.223 -c check_mem
CHECK_MEMORY OK - 844M free | free=885813248b;102851788.8:;30855536.64:
#提示OK了,那么页面应该也正常了。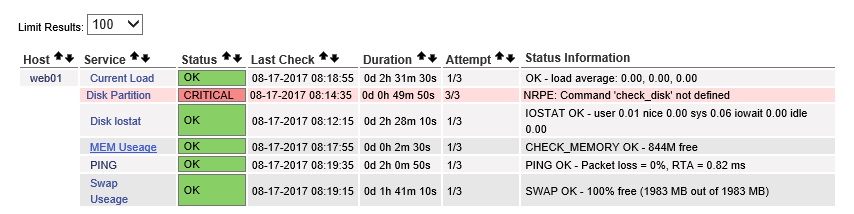
案例2:NRPE:Command ‘check_disk’ not defined排查
该案例涉及的是磁盘监控故障,排查思路如下:
#在Nagios服务器端执行如下命令:
[root@Nagios ~]# /usr/local/nagios/libexec/check_nrpe -H 192.168.0.223 -c check_disk
NRPE: Command 'check_disk' not defined
如果同学们理解了Nagios被动监控的原理,很容易判断上面问题的故障在于nrpe.cfg中check_disk相关命令写错了,或者没配。
根据Nagios被动模式监控原理排查问题的思路如下。
1)在服务器端执行如下命令看是否返回数据
[root@Nagios ~]# /usr/local/nagios/libexec/check_nrpe -H 192.168.0.223 -c check_disk
NRPE: Command 'check_disk' not defined
2)如果前面无法正确返回数据,可在客户端192.168.0.223本地执行如下命令看是否返回数据。
[root@web01 libexec]# /usr/local/nagios/libexec/check_nrpe -H 127.0.0.1 -c check_disk
NRPE: Command 'check_disk' not defined
3)如果前面还是无法正确返回数据,则执行nrpe.cfg里下面配置的内容中等号后面的命令。
即执行如下操作:
[root@web01 libexec]# /usr/local/nagios/libexec/check_disk -w 15% -c 7% -p/
DISK OK - free space: / 15219 MB (90% inode=97%);| /=1590MB;15052;16469;0;17709
由此可以看出是命令的定义名称出现了错误,改回即可。
如果以上三步都OK,那么就找服务器端原因,一般是配置文件以及命令插件问题。
(5)添加http服务的URL地址及端口监控
现在增加从Nagios服务器端发起的监控,如URL地址,端口监控等。此类服务一般都开启了对外提供服务的业务。这样的业务,一般采用主动监控的方式,当然了,也可以写脚本通过被动的方式来监控,但一般不这么做。
URL监控的实质是通过命令行理解HTTP的监控原理,如下:
[root@Nagios ~]# /usr/local/nagios/libexec/check_http -H 192.168.0.223
HTTP OK: HTTP/1.1 200 OK - 249 bytes in 0.002 second response time |time=0.002228s;;;0.000000 size=249B;;;0
下面是对域名URL地址http://www.yunjisuan.com进行监控的配置,将要监控的服务配置到services.cfg中即可。
#在Nagios服务端操作,在services.cfg中添加如下内容
[root@Nagios ~]# cat /usr/local/nagios/etc/objects/services.cfg

define service {
    use generic-service
    host_name web01,web02
    service_description Disk Partition
    check_command check_nrpe!check_disk
}
define service {
    use generic-service
    host_name web01,web02
    service_description Swap Useage
    check_command check_nrpe!check_swap
}
define service {
    use generic-service
    host_name web01,web02
    service_description MEM Useage
    check_command check_nrpe!check_mem
}
define service {
    use generic-service
    host_name web01,web02
    service_description Current Load
    check_command check_nrpe!check_load
}
define service {
    use generic-service
    host_name web01,web02
    service_description Disk lostat
    check_command check_nrpe!check_iostat!5!11
}
define service {
    use generic-service
    host_name web01,web02
    service_description PING
    check_command check_ping!100.0,20%!500.0,60%
}

#url examples http://www.yunjisuan.com      从这里开始是添加的内容

define service {                #用自定义命令对www.yunjisuan.com监控

        use generic-service
        host_name web01
        service_description www_url
    check_command check_weburl! -H www.yunjisuan.com    #check_weburl是自定义命令,在command.cfg中定义。

}

define service {                #利用系统自带插件对Web进行监控

    use generic-service
    host_name web01
    service_description www_url
    check_command check_http

}

define service {                #用自定义命令对复杂URL进行监控

    use generic-service
        host_name web01
        service_description www_static_url
    check_command check_weburl! -H www.yunjisuan.com -u /static/test.html
#-H:主机IP或域名
#-u:URL的URI的部分
}


define service {                #对特殊的带传参的URL地址进行监控时,方式如下:

        use generic-service
        host_name web01
        service_description www_yunjisuan_url
    check_command check_weburl! -H www.yunjisuan.com -u "/article/index.phpm=article&a=list&id=670"

}
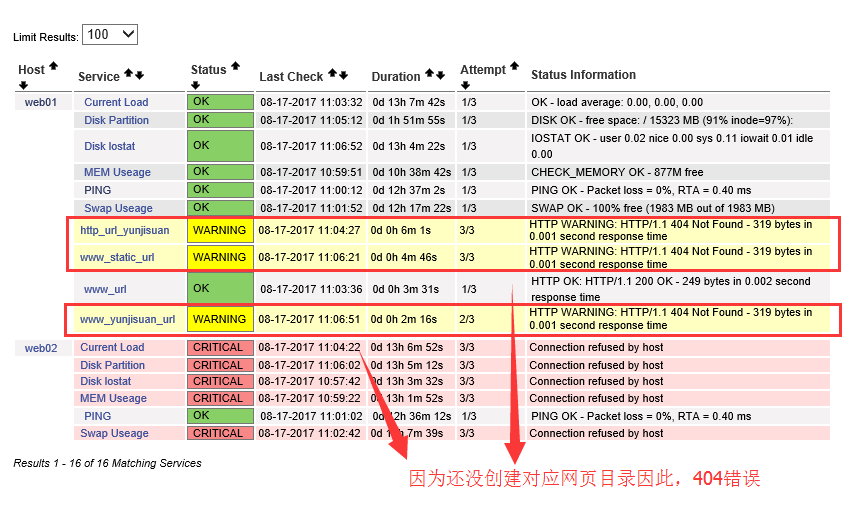
(6)配置好URL后检查Nagios语法
#若在配置好URL后,就执行如下命令检查Nagios语法:
[root@Nagios ~]# /etc/init.d/nagios checkconfig

#会发现报错了

Checking services...
Error: Service check command 'check_weburl' specified in service 'www_static_url' for host 'web01' not defined anywhere!
Error: Service check command 'check_weburl' specified in service 'www_yunjisuan_url' for host 'web01' not defined anywhere!
...省略若干...

Total Warnings: 0
Total Errors:   2
根据报错信息可以知道,是因为在command.cfg配置文件中没有定义check_weburl插件导致的。因此,需要在commands.cfg中加入check_weburl的插件配置。
#在commands.cfg中加入如下配置
[root@Nagios ~]# tail -7 /usr/local/nagios/etc/objects/commands.cfg
# 'check_weburl' command definition
define command {                #定义命令check_weburl

    command_name check_weburl
    command_line $USER1$/check_http $ARG1$ -w 10 -c 30

}
注意:
如果是测试域名URL监控,注意在Nagios服务器端的/etc/hosts里加入如下域名解析
[root@Nagios ~]# tail -2 /etc/hosts
192.168.0.200  nagios-server
192.168.0.223 www.yunjisuan.com bbs.yunjisuan.com
此时执行检查语法的命令:
[root@Nagios ~]# /etc/init.d/nagios checkconfig
Total Warnings: 0
Total Errors:   0

Things look okay - No serious problems were detected during the pre-flight check
 OK.
使配置文件生效的命令为:
[root@Nagios ~]# /etc/init.d/nagios reload
Running configuration check...done.
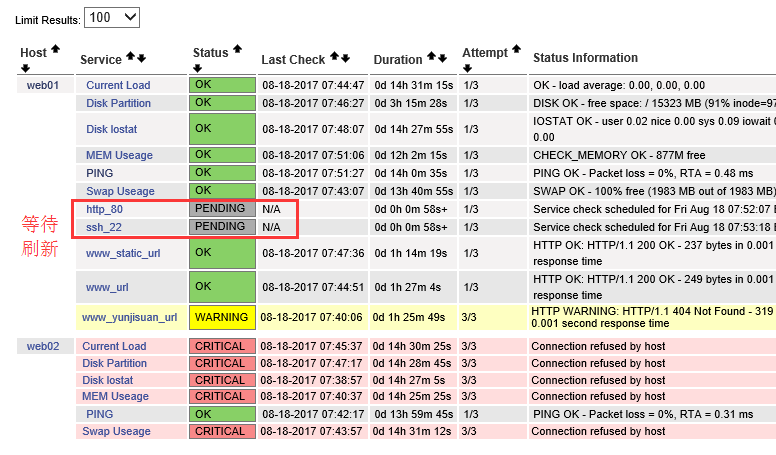
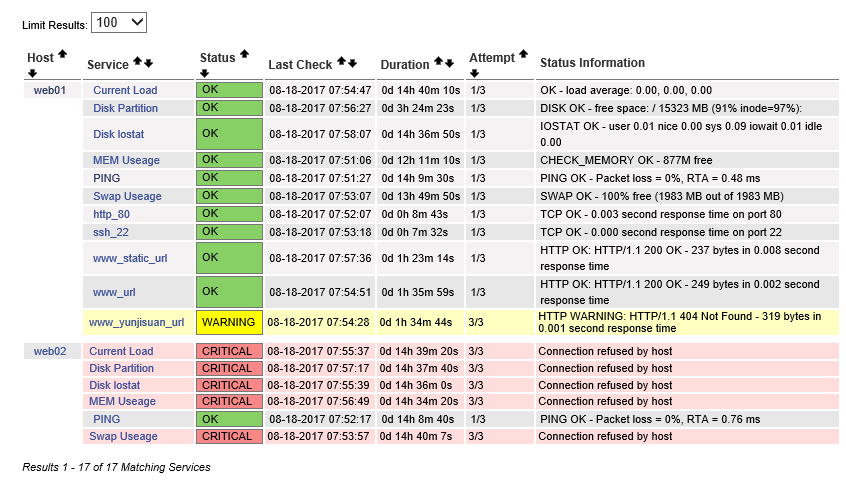
Reloading nagios configuration...done到这里,可以看到自己配置的URL监控成果了,如下图所示:
添加测试网页
#在Web1被监控端操作
[root@web01 ~]# cd /usr/local/nginx/html/www/
[root@web01 www]# ls
index.html  static
[root@web01 www]# ll static/
total 4
-rw-r--r--. 1 root root 13 Jul 27 06:10 index.html
[root@web01 www]# echo "welcome" >> static/test.html
[root@web01 www]# cat static/test.html
welcome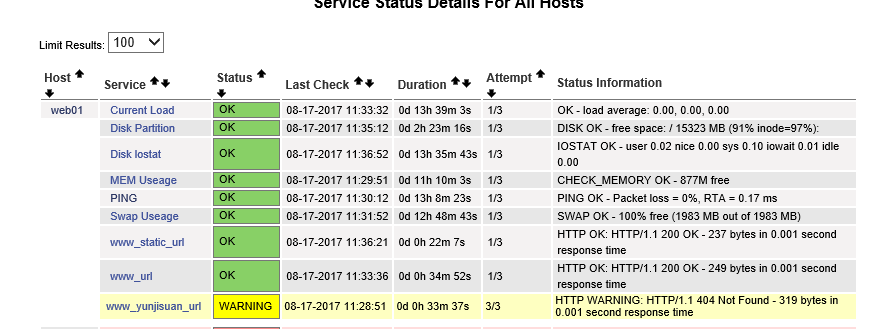
(7)监控任意TCP端口举例
#端口检查的实质就是1执行如下命令去监控
[root@Nagios ~]# /usr/local/nagios/libexec/check_tcp -H192.168.0.223 -p 80
TCP OK - 0.000 second response time on port 80|time=0.000216s;;;0.000000;10.000000

#在services.cfg最后加上如下定义
[root@Nagios objects]# tail -18 /usr/local/nagios/etc/objects/services.cfg
#tcp examples
define service {

    use generic-service
    host_name web01
    service_description ssh_22
    check_command check_tcp! 22

}

define service {

        use generic-service
        host_name web01
        service_description http_80
    check_command check_tcp! 80

}

#这里的check_tcp为Nagios plugin默认插件,commands.cfg会自动配置进去,不需要添加。此外,注意多端口同时监控的写法。
说明:
从多年的监控经验看,端口检查也是很不错的辅助监控方式!对于要求高的业务,一定要模拟真正用户的访问行为监控才好。
5.3 阶段性小结
- 实例暂时就说到这里,关于如何让不同服务在不同时间报警给不同用户,如何配置nfs,rsync,drbd,MySQL,Oracle等特殊服务的监控,如何分组监控,如何让多个运维值班协调解决问题等内容, 请见企业级监控Nagios实践(下)。Nagios很复杂,不仅可以做上面的事,还可以写插件监控业务层的问题,甚至可以监控到服务器的温度及硬件信息。而且,Nagios给你扩展开发的机会很多,请大家多去摸索。这里针对上面的内容小结一下:
- 一般客户端对外开启的服务1,都会采用主动模式监控,例如:port,URL.
主动模式的监控配置过程如下:
1)在服务器端的命令行把要监控的命令先调试好。
2)在commands.cfg里定义Nagios命令,同时调用命令行的插件。
3)在服务的配置文件里定义要监控的服务,调用commands.cfg里定义Nagios的监控命令!
六 拓展实验内容:
- 请用主动及被动模式分别监控MySQL主从同步(check_mysql)!
- 根据不同管理员显示不同的主机和服务,根据用户分类显示主机和服务