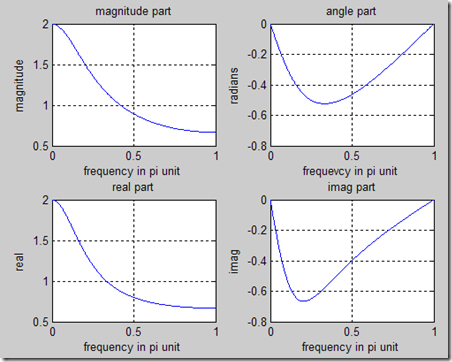
w = [0:1:500]*pi/500;
X= exp(1i*w) ./ (exp(1i*w) - 0.5*ones(1,501)); %ones : Create array of all ones
magX= abs(X);
angX = angle(X);
realX = real(X);
imagX = imag(X);
subplot(2,2,1); plot(w/pi, magX);grid
xlabel('frequency in pi unit' );
title ('magnitude part');
ylabel('magnitude');
subplot(2,2,2);plot(w/pi,angX);grid %subplot 为图表定位 2X2图表中第2张
xlabel('frequevcy in pi unit'); %X轴坐标
title('angle part');
ylabel('radians');
subplot(2,2,3);plot(w/pi, realX );grid %grid为图标加网格线
xlabel('frequency in pi unit' );
title('real part');
ylabel('real');
subplot(2,2,4);plot(w/pi, imagX);grid
xlabel('frequency in pi unit');
title('imag part');
ylabel('imag');
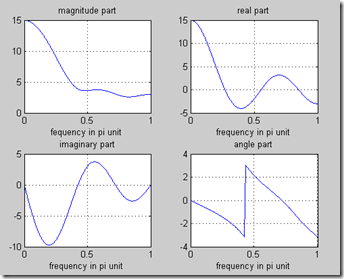
n = -1:3;
x = 1:5;
w= (0:1:500)*pi/500;
X= x* exp(-j).^(n'*w); %n' :矩阵n的转制
realX = real(X);
imagX = imag(X);
angX = angle(X);
magX = abs(X);
subplot(2,2,1);plot(w/pi,magX);grid
xlabel('fequency in pi unit');
title('magnitude part');
subplot(2,2,2);plot(w/pi,realX);grid
xlabel('frequency in pi unit');
title('real part');
subplot(2,2,3);plot(w/pi,imagX);grid
xlabel('frequency in pi unit');
title( 'imaginary part');
subplot(2,2,4);plot(w/pi, angX);grid
xlabel('frequency in pi unit');
title('angle part');
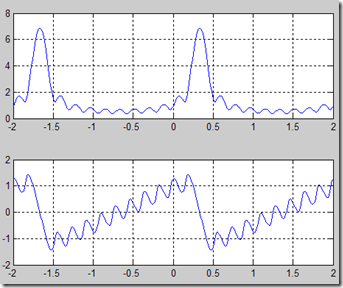
%求出某一f上 所有时间上所有值
n= 0:10;%确定n的范围
w= (-200:1:200)*pi/100;%确定要观察的频率范围
x = (0.9*exp(1i*pi/3)).^n;%确定时间轴上的函数值
X = x*(exp(-1i)).^(n'*w);%转换到频率轴上
magX = abs(X);
angX = angle(X);
subplot(2,1,1);
plot(w/pi,magX);grid
subplot(2,1,2);
plot(w/pi, angX);grid
%axis 轴 axis() axis([xmin xmax ymin ymax])
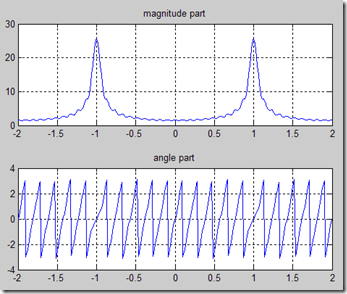
%当输入函数为实数时 观察幅值(偶)与相位(奇)的对称性
n = -10:10 ;
w = (-200:1:200)*pi/100;
x = (-0.9).^n;
X = x * (exp(-1i).^(n'*w));
magX = abs(X);
angX = angle(X);
subplot(2,1,1);
plot(w/pi,magX);grid
axis([-2,2,0,30]);
title('magnitude part');
subplot(2,1,2);
plot(w/pi, angX);grid
title('angle part')


