ref: https://www.get-digital-help.com/custom-data-labels-in-x-y-scatter-chart/
Improve your X Y Scatter Chart with custom data labels
Author: Oscar Cronquist Article last updated on February 25, 2019

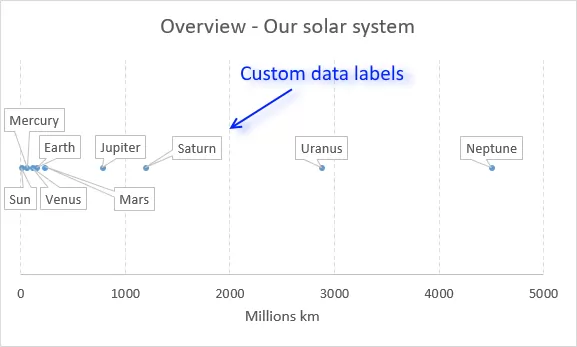
The picture above shows a chart that has custom data labels, they are linked to specific cell values.
What's on this page
- How to apply custom data labels in Excel 2013 and later versions
- How to add data label shapes
- How to rearrange data labels
- Video
- Download Excel file
- Workaround for earlier Excel versions
- Excel Macro - Apply custom data labels
- Where to copy the code
- How to use macro
- Download Excel file
This means that you can build a dynamic chart and automatically change the labels depending on what is shown on the chart.
I have demonstrated how to build dynamic data labels in a previous article if you are interested in using those in a chart.
In a post from March 2013 I demonstrated how to create Custom data labels in a chart.
Unfortunately, that technique worked only for bar and column charts.
You can't apply the same technique for an x y scatter chart, as far as I know.
Luckily the people at Microsoft have heard our prayers.
They have implemented a feature into Excel 2013 that allows you to assign a cell to a chart data point label a, in an x y scatter chart.
I will demonstrate how to do this for Excel 2013 and later versions and a workaround for earlier versions in this article.
How to apply custom data labels in Excel 2013 and later versions
This example chart shows the distance between the planets in our solar system, in an x y scatter chart.
The first 3 steps tells you how to build a scatter chart.
-
Select cell range B3:C11
-
Go to tab "Insert"
-
Click the "scatter" button
-
Right click on a chart dot and left click on "Add Data Labels"
-
Right click on a dot again and left click "Format Data Labels"
-
A new window appears to the right, deselect X and Y Value.
-
Enable "Value from cells"
-
Select cell range D3:D11
-
Click OK
This is what the chart shows, as you can see you need to manually rearrange the data labels and add data label shapes.
Back to top
Video
This following video shows you how to add data labels in an X Y Scatter Chart [Excel 2013 and later versions].
Back to top
Learn more
Axis | Chart Area | Chart Title | Axis Titles | Axis lines | Chart Legend | Tick Marks | Plot Area | Data Series | Data Labels | Gridlines
How to add data label shapes
- Right-click on a data label.
- Click on "Change data label shapes".
- Select a shape.
Back to top
How to change data label locations
You can manually click and drag data labels as needed. You can also let excel change the position of all data labels, choose between center, left, right, above and below.
-
Right-click on a data label
-
Click "Format Data Labels"
-
Select a new label position.
Back to top