3.1 基本条形图
library(ggplot2)
library(gcookbook)
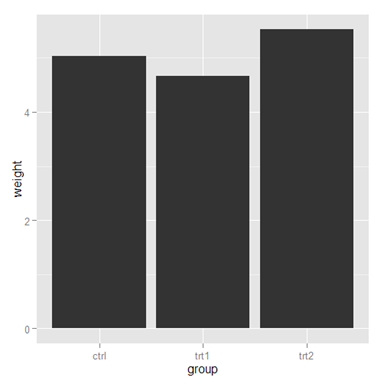
pg_mean #这是用到的数据
group weight
1 ctrl 5.032
2 trt1 4.661
3 trt2 5.526
ggplot(pg_mean, aes(x=group, y=weight)) + geom_bar(stat="identity")
x轴是连续变量还是因子,画出的图有所不同,这里的group是因子。
str(pg_mean)
'data.frame': 3 obs. of 2 variables:
$ group : Factor w/ 3 levels "ctrl","trt1",..: 1 2 3 #可以看出group是因子
$ weight: num 5.03 4.66 5.53
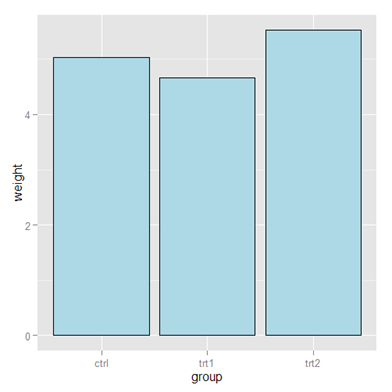
用fill设置填充色,用color设置边框颜色
ggplot(pg_mean, aes(x=group, y=weight)) + geom_bar(stat="identity", fill="lightblue", color="black")
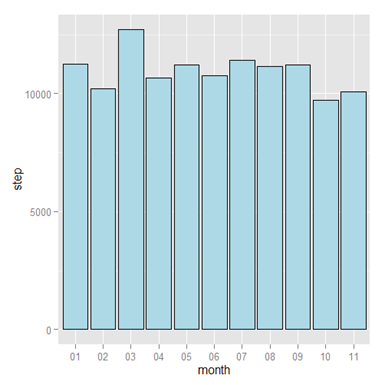
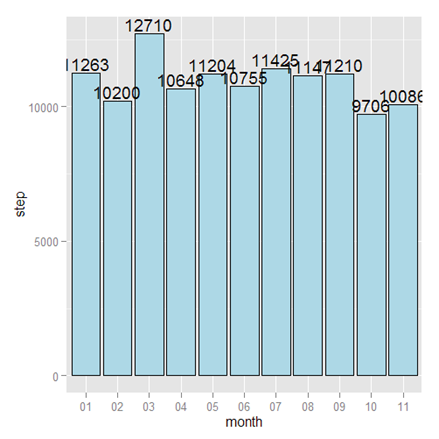
用我的计步数据试试:
Sys.setenv(JAVA_HOME='C:/Program Files/Java/jdk1.6.0_33/jre')
library(xlsx)
setwd("d:/shenlb/health")
fitbit <- read.xlsx(file="fitbit2014.xlsx", header=TRUE, sheetIndex=1) #用到JAVA,比read.csv慢了不少
meanMonthStep <- aggregate(fitbit$step, by=list(format(fitbit$date,"%m")), mean)
colnames(meanMonthStep) <- c("month","step") #设置列名
ggplot(meanMonthStep, aes(x=month, y=step)) + geom_bar(stat="identity", fill="lightblue", color="black")
3.2 Grouping Bars Together
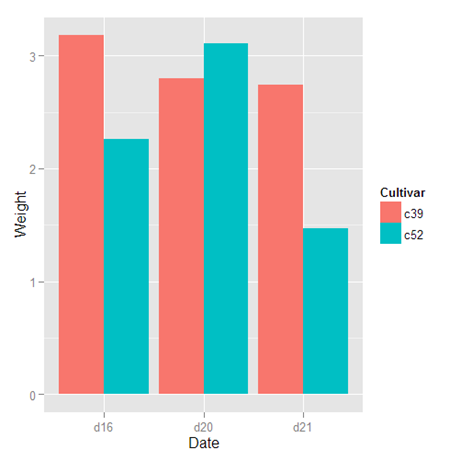
cabbage_exp
Cultivar Date Weight sd n se
1 c39 d16 3.18 0.9566144 10 0.30250803
2 c39 d20 2.80 0.2788867 10 0.08819171
3 c39 d21 2.74 0.9834181 10 0.31098410
4 c52 d16 2.26 0.4452215 10 0.14079141
5 c52 d20 3.11 0.7908505 10 0.25008887
6 c52 d21 1.47 0.2110819 10 0.06674995
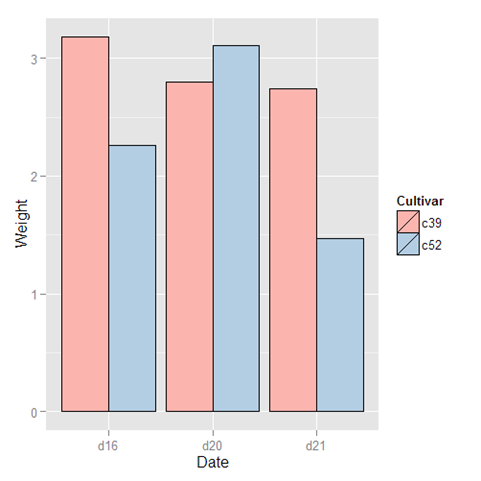
条形图的x轴通常是一个分类变量,y轴是连续变量,经常还会提供另一个分类变量,进行分组比较,这里用Cultivar,放在fill属性中(实际上还可以用其它显示样式,但填充色最容易区分不同的可视化对象),用dodge选项使它们互相躲避。
ggplot(cabbage_exp, aes(x=Date, y=Weight, fill=Cultivar)) + geom_bar(stat="identity", position="dodge")
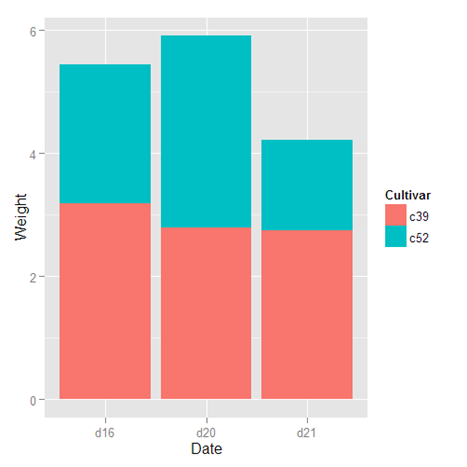
如果没有用position=”dodge”选项,则是堆叠条形图。
ggplot(cabbage_exp, aes(x=Date, y=Weight, fill=Cultivar)) + geom_bar(stat="identity")
还可以用其它的调色板进行填充:
ggplot(cabbage_exp, aes(x=Date, y=Weight, fill=Cultivar)) +
geom_bar(stat="identity", position="dodge", color="black") +
scale_fill_brewer(palette="Pastel1")
3.3. Making a Bar Graph of Counts
head(diamonds)
carat cut color clarity depth table price x y z
1 0.23 Ideal E SI2 61.5 55 326 3.95 3.98 2.43
2 0.21 Premium E SI1 59.8 61 326 3.89 3.84 2.31
3 0.23 Good E VS1 56.9 65 327 4.05 4.07 2.31
4 0.29 Premium I VS2 62.4 58 334 4.20 4.23 2.63
5 0.31 Good J SI2 63.3 58 335 4.34 4.35 2.75
6 0.24 Very Good J VVS2 62.8 57 336 3.94 3.96 2.48
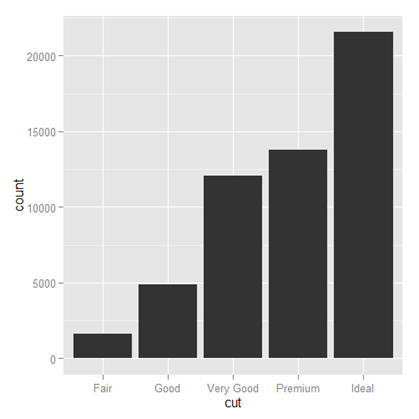
如果只是想按某个分类变量统计出现的个数,则:
ggplot(diamonds, aes(x=cut)) + geom_bar()
它实际上等价于下面的命令:
ggplot(diamonds, aes(x=cut)) + geom_bar(stat="bin")
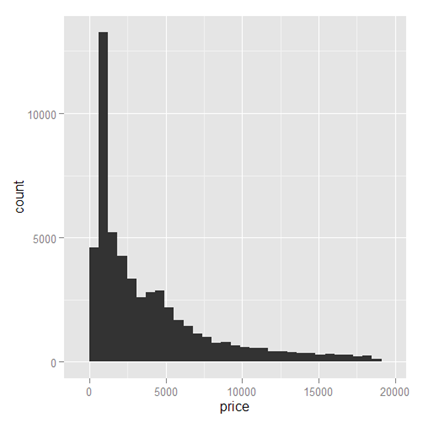
上面的例子的x轴用的是分类变量,如果用连续变量,则会得到直方图。
ggplot(diamonds, aes(x=price)) + geom_bar(stat="bin")
这时最好用geom_histogram():
ggplot(diamonds, aes(x=price)) + geom_histogram()
3.4. Using Colors in a Bar Graph
把计步数据用指定的颜色填充。这里只有11个月,所以造了11种颜色。
ggplot(meanMonthStep, aes(x=month, y=step, fill=month)) +
geom_bar(stat="identity", color="black") +
scale_fill_manual(values=c("#111111", "#222222", "#333333", "#444444", "#555555", "#666666",
"#777777", "#888888", "#999999", "#AAAAAA", "#BBBBBB"))
如果想移除右侧的图例,用guide=FALSE
ggplot(meanMonthStep, aes(x=month, y=step, fill=month)) +
geom_bar(stat="identity", color="black") +
scale_fill_manual(values=c("#111111", "#222222", "#333333", "#444444", "#555555", "#666666",
"#777777", "#888888", "#999999", "#AAAAAA", "#BBBBBB"), guide=FALSE)
加文本标签
ggplot(meanMonthStep, aes(x=month, y=step)) +
geom_bar(stat="identity", fill="lightblue", color="black") +
geom_text(aes(label=floor(step)), vjust=-0.2)
