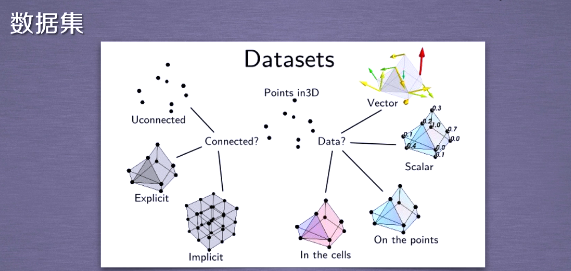
一:数据集
三维可视化的第一步是选用合适的数据结构来表示数据,TVTK提供了多种表示不同种类数据的数据集

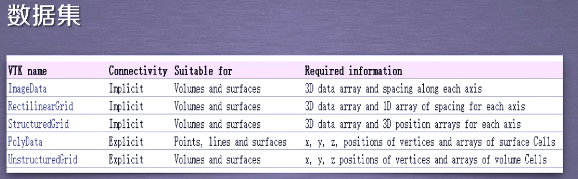
(一)数据集--ImageData

>>> from tvtk.api import tvtk
>>> img = tvtk.ImageData(spacing=(1,1,1),origin=(1,2,3),dimensions=(3,4,5))
>>> img.get_point(0)
(1.0, 2.0, 3.0)
>>> for n in range(6):  #只是输出了6个点,不止这么多
...     print("%.1f,%.1f,%.1f"%img.get_point(n))
...
1.0,2.0,3.0
2.0,2.0,3.0
3.0,2.0,3.0
1.0,3.0,3.0
2.0,3.0,3.0
3.0,3.0,3.0
>>>

(二)数据集--RectilinearGrid
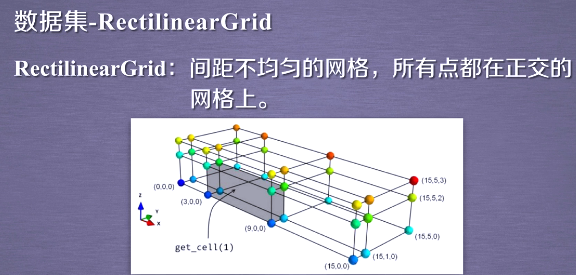
from tvtk.api import tvtk
import numpy as np

x = np.array([0,3,9,15])    #x轴4个点长度
y = np.array([0,1,5])       #y轴3个点长度
z = np.array([0,2,3])       #z轴3个点长度
r = tvtk.RectilinearGrid()  #完成构建
r.x_coordinates = x         #分别设置给各个点坐标
r.y_coordinates = y
r.z_coordinates = z
r.dimensions = len(x),len(y),len(z)
for n in range(6):
    print(r.get_point(n))
(0.0, 0.0, 0.0)  #和ImageData数据一样,分别沿着x,y,z方向进行递增
(3.0, 0.0, 0.0)  #向x
(9.0, 0.0, 0.0)
(15.0, 0.0, 0.0)
(0.0, 1.0, 0.0)  #向y增1
(3.0, 1.0, 0.0)  #继续x
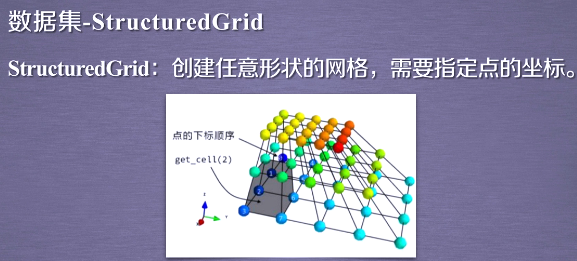
(三)数据集--StructuredGrid
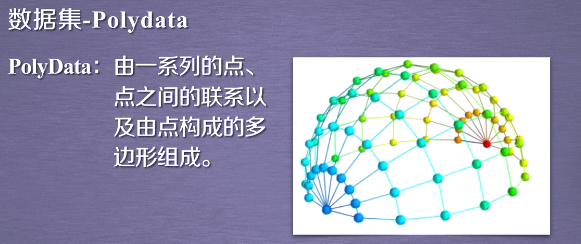
(四)数据集--PolyData