在使用这个chart.js之前,自己写过一个饼图,总之碰到的问题不少,所以能用现成的插件就用,能节省不少时间
这里不打算介绍chart.js里面详细的参数意义和各个参数的用法,只作为首次使用chart.js的一个入门级的说明!
在使用之前,我找到了一个中文的chart.js的文档地址:http://www.bootcss.com/p/chart.js/docs/,打开后发现除了菜单是中文的,其他还是英文的,这个可能是从官方直接扒下来的版本,很久没更新了,部分参数和官方已经差距很大,还是直接看官方的吧http://www.chartjs.org/
首先还是npm安装chart.js
npm install chart.js --save
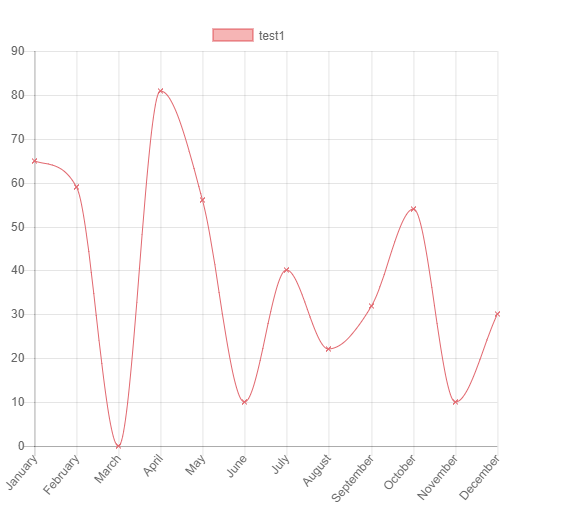
这里直接贴出来一个折线图的代码好了,比较直接
<template>
    <div class="small">

        <canvas id="myChart2" width="400px" height="400px"></canvas>
    </div>
</template>
<script>
import Chart from 'chart.js';


export default {
    components: {

    },
    data() {
        return {

        }
    },
    mounted() {


        var ctx2 = document.getElementById("myChart2");

        var myChart2 = new Chart(ctx2, {
            type: "line",
            data: {
                labels: ["January", "February", "March", "April", "May", "June", "July", "August", "September", "October", "November", "December"],
                datasets: [
                    {
                        label: "test1",
                        backgroundColor: "rgba(225,10,10,0.3)",
                        borderColor: "rgba(225,103,110,1)",
                        borderWidth: 1,
                        pointStrokeColor: "#fff",
                        pointStyle: "crossRot",
                        data: [65, 59, 0, 81, 56, 10, 40, 22, 32, 54, 10, 30],
                        cubicInterpolationMode: "monotone",
                        spanGaps: "false",
                        fill: "false"
                    }
                ]
            },
            options: {

            }

        });
    },
    methods: {

    }
}
</script>
<style>
.small {
     500px;
    height: 500px;
}
</style>
效果图如下
new Chart(ctx2, configObject) 中的configObject对象中有三个重要的属性
          {
                type: "",
                data: {
                },
                options: {

                }

            }
type属性表示图形形状
line:折线图
bar:柱状图
Radar:雷达图/蛛网图
doughnut:圆环图
pie:饼图
polarArea:极地区域图
bubble:气泡分布图
scatter:散点图
data属性配置图形上的数据,data里的数据可以参考各个type的图每个参数的说明
options配置图形其他的可选项
另外我们选用一个库的一个很重要的因素是这个库浏览器的支持程度,经过实际的测试
IE9+和chrome,firefox支持canvas的都可以使用。
针对vue.js封装的vue-chartjs库:http://vue-chartjs.org,由于是封装库,几乎所有的参数都要参考chart.js的配置,只不过使用的方式改为vue特有的组件的形式
首先还是安装库
npm install vue-chartjs --save
例如我们要创建一个折线图
LineChart.js
import { Line, mixins } from 'vue-chartjs'
const { reactiveProp } = mixins

export default Line.extend({
  mixins: [reactiveProp],
  props: ['options'],
  mounted () {
    // this.chartData is created in the mixin
    this.renderChart(this.chartData, this.options)
  }
})
RandomChart.vue
<template>
    <div class="small">
        <line-chart :chart-data="datacollection"></line-chart>
        <button @click="fillData()">Randomize</button>
    </div>
</template>

<script>
import LineChart from './LineChart.js'

export default {
    components: {
        LineChart
    },
    data() {
        return {
            datacollection: { labels: [], datasets: [] }
        }
    },
    mounted() {
        this.fillData()
    },
    methods: {
        fillData() {

            let result = {
                labels: [this.getRandomInt(), this.getRandomInt(), this.getRandomInt(),this.getRandomInt()],
                datasets: [
                    {
                        label: 'Data One',
                        backgroundColor: '#f87979',
                        data: [this.getRandomInt(), this.getRandomInt(), this.getRandomInt(),this.getRandomInt()]
                    }, {
                        label: 'Data One',
                        backgroundColor: '#0f0',
                        data: [this.getRandomInt(), this.getRandomInt(), this.getRandomInt(),this.getRandomInt()]
                    }
                ]
            };

            console.log(result);
            this.datacollection = result;
        },
        getRandomInt() {
            return Math.floor(Math.random() * (50 - 5 + 1)) + 5
        }
    }
}
</script>

<style>
.small {
    max- 600px;
    margin: 150px auto;
}
</style>
如果在没有掌握chart.js的用法之前直接使用vue-chartjs的话,可能会有一些困难,vue-chartjs官方的文档只介绍了如何创建和使用插件部分,详细的属性配置还是需要去chart.js的文档里面找。