%% 绘制三维曲线
%plot3函数,其中每一组x,y,z组成一组曲线的坐标参数,选项的定义和plot函数相同。
%1、当x,y,z是同维向量时,则x,y,z 对应元素构成一条三维曲线。
x0 = 0:pi/50:10*pi;
y0 = sin(x0);z0 = cos(x0);
y0=y0'; %将y转置为列向量试试
plot3(x0,y0,z0);grid on; %不影像结果
title('Line in 3-D Space');
%2、当x,y,z是同维矩阵时,则以x,y,z对应列元素绘制三维曲线,曲线条数等于矩阵_列数_
x1(:,1)=0:pi/50:10*pi;
x1(:,2)=-13*pi:pi/50:-3*pi;
y1 = sin(x1); z1 = cos(x1);
plot3(x1,y1,z1);grid on;
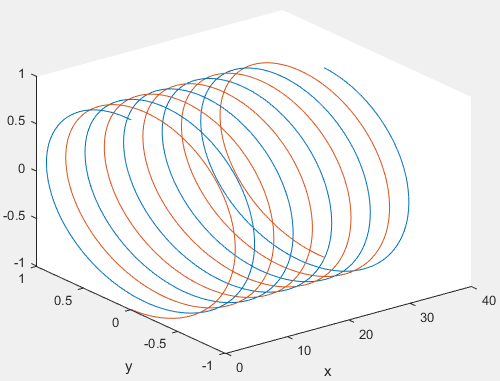
%3、如果X,Y,Z中有向量也有矩阵,则向量是根据矩阵的行_或_列绘制
%depending whether the vectors' lengths equal the number of rows or the number of columns.
plot3(x0,y1,z1);grid on; %可见x轴的范围仍是x0的范围
xlabel('x');ylabel('y');zlabel('z');
%第一条线是 x0,y1(:,1),z1(:,1)
%第二条线是 x0,y1(:,2),z1(:,2)
%%%%%证明如下:
figure;
plot3(x0,y1(:,1),z1(:,1)); hold on;
plot3(x0,y1(:,2),z1(:,2)); hold off;
xlabel('x');ylabel('y');zlabel('z');
%%%%%证明完毕
<wiz_tmp_tag id="wiz-table-range-border" contenteditable="false" style="display: none;">