遇到一需求,一般都是点击图后获取其中一组数据就可以了,不需要详细到获取点击了当前X轴对应的其中的哪个,
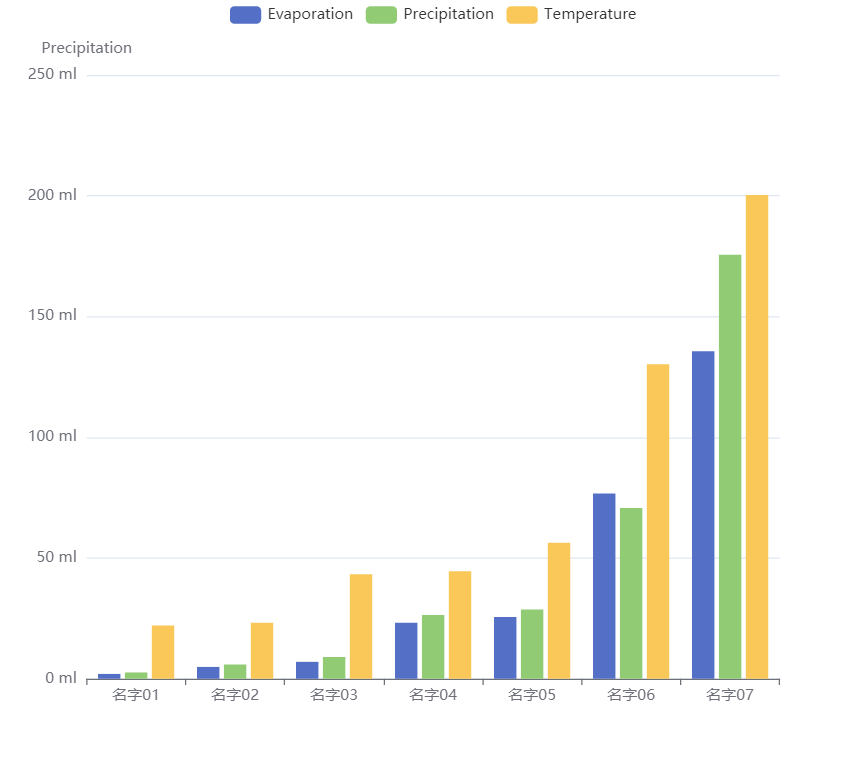
今天的需求是 Echarts点击多组数据多个柱子中的一个柱子,获取当前点击的是第几组数据,并获取点击的是当前组别第几根柱子,以及对应横坐标
下面是解决方案
先上图

再上代码
option = {
  tooltip: {
    trigger: 'axis',
    axisPointer: {
      type: 'cross',
      crossStyle: {
        color: '#999'
      }
    }
  },
  toolbox: {
    feature: {
      dataView: { show: true, readOnly: false },
      magicType: { show: true, type: ['line', 'bar'] },
      restore: { show: true },
      saveAsImage: { show: true }
    }
  },
  legend: {
    data: ['Evaporation', 'Precipitation', 'Temperature']
  },
  xAxis: [
    {
      type: 'category',
      data: ['名字01', '名字02', '名字03', '名字04', '名字05', '名字06', '名字07'],
      axisPointer: {
        type: 'shadow'
      }
    }
  ],
  yAxis: [
    {
      type: 'value',
      name: 'Precipitation',
      min: 0,
      max: 250,
      interval: 50,
      axisLabel: {
        formatter: '{value} ml'
      }
    }
  ],
  series: [
    {
      name: 'Evaporation',
      type: 'bar',
      data: [
        2.0, 4.9, 7.0, 23.2, 25.6, 76.7, 135.6
      ]
    },
    {
      name: 'Precipitation',
      type: 'bar',
      data: [
        2.6, 5.9, 9.0, 26.4, 28.7, 70.7, 175.6
      ]
    },
    {
      name: 'Temperature',
      type: 'bar',
      data: [22.0, 23.2, 43.3, 44.5, 56.3, 130.2, 200.3]
    }
  ]
};

myChart.getZr().off(); // 这个代码很重要,必须要加上,要不然的话你可以试试看
    myChart.getZr().on('click', params => {

      const actionObj = params.target
      console.log('actionObj', actionObj)
      const myKey = Object.keys(actionObj).sort().filter(_ => _.indexOf('ec_inner') !== -1)[0]
      console.log('myKey', myKey)
      const res = actionObj[myKey]
      console.log(`当前点击了第${res.dataIndex}组数据中的第${res.seriesIndex}个柱子`)
      var pointInPixel = [params.offsetX, params.offsetY];
      if (myChart.containPixel('grid', pointInPixel)) {
        /*此处添加具体执行代码*/
        var pointInGrid = myChart.convertFromPixel({ seriesIndex: 0 }, pointInPixel);
        //X轴序号
        var xIndex = pointInGrid[0];
        console.log('点击了横纵坐标', pointInPixel)
        console.log('【点击了第几组数据,纵坐标】', pointInGrid)
        //获取当前图表的option
        var op = myChart.getOption();
        console.log('数据信息', op)
        //获得图表中我们想要的数据---下面就不简写了,默认说我们的折现有2条吧
        var xValue = op.xAxis[0].data[xIndex];
        console.log('x轴所对应的名字', xValue)
        console.log('点击的这个柱子的名字', op.series[res.seriesIndex].name,'点击的这个柱子的值',op.series[res.seriesIndex].data[res.dataIndex])
      }
    });
最后希望路过的可以提供一下更好的方案哦~~~
学无止境,合作共赢!!