思路:从mysql数据库查询数据,经过thinkphp 后端控制器做逻辑处理,返回给前端,前端调用Amcharts 插件
1.数据查询:
public function order($time='',$radio=1){
        if($time== ''){
            $time = Date("Y");
        }
        $bt = $time."-01-01 00:00:00";
        $et = (string)((int)$time+1)."-01-01 00:00:00";
        $sql='';
        if($radio==1){
            $sql="SELECT right(tt.month,2) as month, IFNULL( we.web, 0 ) as web, IFNULL( wx.weixin, 0 ) as weixin, IFNULL( ad.andriod, 0 ) as andriod , IFNULL( ip.iphone, 0 ) as iphone
            FROM (
            (

            SELECT DATE_FORMAT(  `AddTime` ,  '%Y-%m' ) AS
            MONTH FROM  `order`
            WHERE State = 2
            AND AddTime >= '$bt'
            AND AddTime < '$et'
            GROUP BY MONTH
            ) AS tt
            LEFT JOIN (

            SELECT DATE_FORMAT(  `AddTime` ,  '%Y-%m' ) AS
            MONTH , SUM(  `PayMoney` ) AS web
            FROM  `order`
            WHERE  `OrderSource` =1
            AND State = 2
            AND AddTime >= '$bt'
            AND AddTime < '$et'
            GROUP BY MONTH
            ) AS we ON tt.month = we.month
            LEFT JOIN (

            SELECT DATE_FORMAT(  `AddTime` ,  '%Y-%m' ) AS
            MONTH , SUM(  `PayMoney` ) AS weixin
            FROM  `order`
            WHERE  `OrderSource` =2
            AND State = 2
            AND AddTime >= '$bt'
            AND AddTime < '$et'
            GROUP BY MONTH
            ) AS wx ON tt.month = wx.month
            LEFT JOIN (

            SELECT DATE_FORMAT(  `AddTime` ,  '%Y-%m' ) AS
            MONTH , SUM(  `PayMoney` ) AS andriod
            FROM  `order`
            WHERE  `OrderSource` =3
            AND State = 2
            AND AddTime >= '$bt'
            AND AddTime < '$et'
            GROUP BY MONTH
            ) AS ad ON tt.month = ad.month
            LEFT JOIN (

            SELECT DATE_FORMAT(  `AddTime` ,  '%Y-%m' ) AS
            MONTH , SUM(  `PayMoney` ) AS iphone
            FROM  `order`
            WHERE  `OrderSource` =4
            AND State = 2
            AND AddTime >= '$bt'
            AND AddTime < '$et'
            GROUP BY MONTH
            ) AS ip ON tt.month = ip.month
            )";
        }else{
            $sql="SELECT right(tt.month,2) as month, IFNULL( we.web, 0 ) as web, IFNULL( wx.weixin, 0 ) as weixin, IFNULL( ad.andriod, 0 ) as andriod, IFNULL( ip.iphone, 0 ) as iphone
            FROM (
            (

            SELECT DATE_FORMAT(  `AddTime` ,  '%Y-%m' ) AS
            MONTH FROM  `order`
            WHERE State = 2
            AND AddTime >= '$bt'
            AND AddTime < '$et'
            GROUP BY MONTH
            ) AS tt
            LEFT JOIN (

            SELECT DATE_FORMAT(  `AddTime` ,  '%Y-%m' ) AS
            MONTH , count(  `id` ) AS web
            FROM  `order`
            WHERE  `OrderSource` =1
            AND State = 2
            AND AddTime >= '$bt'
            AND AddTime < '$et'
            GROUP BY MONTH
            ) AS we ON tt.month = we.month
            LEFT JOIN (

            SELECT DATE_FORMAT(  `AddTime` ,  '%Y-%m' ) AS
            MONTH , count(  `id` ) AS weixin
            FROM  `order`
            WHERE  `OrderSource` =2
            AND State = 2
            AND AddTime >= '$bt'
            AND AddTime < '$et'
            GROUP BY MONTH
            ) AS wx ON tt.month = wx.month
            LEFT JOIN (

            SELECT DATE_FORMAT(  `AddTime` ,  '%Y-%m' ) AS
            MONTH , count(  `id` ) AS andriod
            FROM  `order`
            WHERE  `OrderSource` =3
            AND State = 2
            AND AddTime >= '$bt'
            AND AddTime < '$et'
            GROUP BY MONTH
            ) AS ad ON tt.month = ad.month
            LEFT JOIN (

            SELECT DATE_FORMAT(  `AddTime` ,  '%Y-%m' ) AS
            MONTH , count(  `id` ) AS iphone
            FROM  `order`
            WHERE  `OrderSource` =4
            AND State = 2
            AND AddTime >= '$bt'
            AND AddTime < '$et'
            GROUP BY MONTH
            ) AS ip ON tt.month = ip.month
            )";
        }
        $m = new Model();//实例化对象模型
        //echo $sql;
        $o = $m->query($sql);
        //dump(json_encode($o));
        $this-> o = json_encode($o);
        $this-> ol = $o;
        $this-> time = $time;
        $this-> radio = $radio;
        $this-> timearr = $temp;
        $this ->display('order');
        }


    public function recharge($time='',$radio=1,$year=NULL,$month=NULL){
        $this->meta_title = '充值信息统计';
        $sql= '';
        if($radio==1){//按月统计
            if($time== ''){
            $time = Date("Y");
            }
            $bt = $time."-01-01 00:00:00";
            $et = (string)((int)$time+1)."-01-01 00:00:00";
            $sql="SELECT right(tt.month,2) as month, IFNULL( we.usum, 0 ) as usum
            FROM (
            (
            SELECT DATE_FORMAT(  `AddTime` ,  '%Y-%m' ) AS
            MONTH FROM  `recharge`
            WHERE PayType in(0,1)
            AND AddTime >= '$bt'
            AND AddTime < '$et'
            GROUP BY MONTH
            ) AS tt
            LEFT JOIN (
            SELECT DATE_FORMAT(  `AddTime` ,  '%Y-%m' ) AS
            MONTH , sum(  `Money` ) AS usum
            FROM  `recharge`
            WHERE PayType in(0,1)
            AND AddTime >= '$bt'
            AND AddTime < '$et'
            GROUP BY MONTH
            ) AS we ON tt.month = we.month
            )";
            $this-> showname = '月';
        }else{//按天统计
            if(!$year){
                $year = Date("Y");
            }
            $time = Date("Y");
            if(!$month){
                $month = Date("m");
            }
            $bt = $year.'-'.$month."-01 00:00:00";
            $et = date('Y-m-d H:i:s',strtotime('+1 month',strtotime($bt)));
             $sql="SELECT right(tt.month,2) as month, IFNULL( we.usum, 0 ) as usum
            FROM (
            (
            SELECT DATE_FORMAT(  `AddTime` ,  '%Y-%m-%d' ) AS
            MONTH FROM  `recharge`
            WHERE PayType in(0,1)
            AND AddTime >= '$bt'
            AND AddTime < '$et'
            GROUP BY MONTH
            ) AS tt
            LEFT JOIN (
            SELECT DATE_FORMAT(  `AddTime` ,  '%Y-%m-%d' ) AS
            MONTH , sum(  `Money` ) AS usum
            FROM  `recharge`
            WHERE PayType in(0,1)
            AND AddTime >= '$bt'
            AND AddTime < '$et'
            GROUP BY MONTH
            ) AS we ON tt.month = we.month
            )";
            $this-> showname = '天';
        }

        $m = new Model();//实例化对象模型
        //echo $sql;
        $o = $m->query($sql);
        //dump($o);
        $this-> o = json_encode($o);
        $this-> ol = $o;
        $this-> time = $time;
        $this-> radio = $radio;
        $this-> year = $year;
        $this-> month = $month;
        $this ->display('recharge');
    }
用到分组查询,sql 函数 有
A. right(tt.month,2) as month
B. IFNULL( we.usum, 0 ) as usum
C. count( `id` ) AS unum
D. sum( `Money` ) AS usum
E. SELECT DATE_FORMAT( `AddTime` , '%Y-%m' ) AS
MONTH FROM `table`
WHERE XXXXX
GROUP BY MONTH(分组group by 直接用select 后面的month即可)
'%Y-%m' 是时间格式,DATE_FORMAT 用于时间格式为“2012-01-01 00:01:22”的这种形式。
F. SELECT FROM_UNIXTIME( `AddTime` , '%Y-%m-%d') AS
MONTH , count( `id` ) AS unum
FROM `table`
WHERE XXXXX
GROUP BY MONTH
FROM_UNIXTIME 用于时间戳格式。
分组的思想是先查询出有哪些组,然后在查询出符合的数据,然后用left join 来组合。
2. 前端数据整合
A. 数据格式
给前端的数据格式为JSON:
var chartData = [
{
"month": "01",
"web": 2.5,
"weixin": 2.5,
"andriod": 2.1,
"iphone": 1.3
},
{
"month": "02",
"web": 2.6,
"weixin": 2.7,
"andriod": 2.2,
"iphone": 1.3
},
{
"month": "03",
"web": 2.5,
"weixin": 2.5,
"andriod": 2.1,
"iphone": 1.3
},
{
"month": "04",
"web": 2.6,
"weixin": 2.7,
"andriod": 2.2,
"iphone": 1.3
},
{
"month": "05",
"web": 2.8,
"weixin": 2.9,
"andriod": 2.4,
"iphone": 1.3
},
{
"month": "06",
"web": 2.8,
"weixin": 2.9,
"andriod": 2.4,
"iphone": 1.3
},
{
"month": "07",
"web": 2.5,
"weixin": 2.5,
"andriod": 2.1,
"iphone": 1.3
},
{
"month": "08",
"web": 2.6,
"weixin": 2.7,
"andriod": 2.2,
"iphone": 1.3
},
{
"month": "09",
"web": 2.8,
"weixin": 2.9,
"andriod": 2.4,
"iphone": 1.3
},
{
"month": "10",
"web": 2.8,
"weixin": 2.9,
"andriod": 2.4,
"iphone": 1.3
},
{
"month": "11",
"web": 2.8,
"weixin": 2.9,
"andriod": 2.4,
"iphone": 1.3
},
{
"month": "12",
"web": 2.8,
"weixin": 2.9,
"andriod": 2.4,
"iphone": 1.3
}
];
thinkphp 查询出来的数据时数组,用json_encode 转换成JSON 数组
$o = $m->query($sql);
$this-> o = json_encode($o);
$this-> ol = $o;
B. html 代码(要画图的层)
<div id="chartdiv" style=" 700px; height: 500px;float:left"></div>
C. 画图
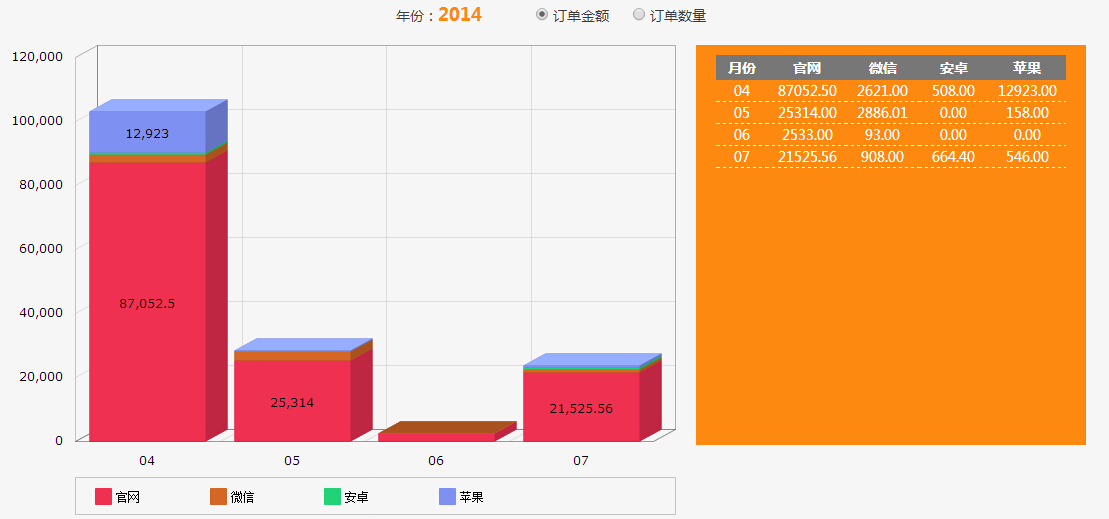
柱状图:
var chart;
            var chartData = <?=$o?>;
                        AmCharts.ready(function () {
                // SERIAL CHART
                chart = new AmCharts.AmSerialChart();
                chart.dataProvider = chartData;
                chart.categoryField = "month";
                chart.plotAreaBorderAlpha = 0.2;

                // AXES
                // category
                var categoryAxis = chart.categoryAxis;
                categoryAxis.gridAlpha = 0.1;
                categoryAxis.axisAlpha = 0;
                categoryAxis.gridPosition = "start";

                // value
                var valueAxis = new AmCharts.ValueAxis();
                valueAxis.stackType = "regular";
                valueAxis.gridAlpha = 0.1;
                valueAxis.axisAlpha = 0;
                chart.addValueAxis(valueAxis);

                // GRAPHS
                // first graph
                var graph = new AmCharts.AmGraph();
                graph.title = "官网";
                graph.labelText = "[[value]]";
                graph.valueField = "web";
                graph.type = "column";
                graph.lineAlpha = 0;
                graph.fillAlphas = 1;
                graph.lineColor = "#ef3051";
                graph.balloonText = "<span style='color:#555555;'>[[category]]</span><br><span style='font-size:14px'>[[title]]:<b>[[value]]</b></span>";
                chart.addGraph(graph);

                // second graph
                graph = new AmCharts.AmGraph();
                graph.title = "微信";
                graph.labelText = "[[value]]";
                graph.valueField = "weixin";
                graph.type = "column";
                graph.lineAlpha = 0;
                graph.fillAlphas = 1;
                graph.lineColor = "#d46724";
                graph.balloonText = "<span style='color:#555555;'>[[category]]</span><br><span style='font-size:14px'>[[title]]:<b>[[value]]</b></span>";
                chart.addGraph(graph);

                // third graph
                graph = new AmCharts.AmGraph();
                graph.title = "安卓";
                graph.labelText = "[[value]]";
                graph.valueField = "andriod";
                graph.type = "column";
                //graph.newStack = true; // this line starts new stack
                graph.lineAlpha = 0;
                graph.fillAlphas = 1;
                graph.lineColor = "#21d277";
                graph.balloonText = "<span style='color:#555555;'>[[category]]</span><br><span style='font-size:14px'>[[title]]:<b>[[value]]</b></span>";
                chart.addGraph(graph);

                // fourth graph
                graph = new AmCharts.AmGraph();
                graph.title = "苹果";
                graph.labelText = "[[value]]";
                graph.valueField = "iphone";
                graph.type = "column";
                graph.lineAlpha = 0;
                graph.fillAlphas = 1;
                graph.lineColor = "#7e90f2";
                graph.balloonText = "<span style='color:#555555;'>[[category]]</span><br><span style='font-size:14px'>[[title]]:<b>[[value]]</b></span>";
                chart.addGraph(graph);

                // LEGEND
                var legend = new AmCharts.AmLegend();
                legend.borderAlpha = 0.2;
                legend.horizontalGap = 10;
                chart.addLegend(legend);
                chart.depth3D = 25;
                chart.angle = 30;

                // WRITE
                chart.write("chartdiv");
            });

            // this method sets chart 2D/3D
            function setDepth() {
                if (document.getElementById("rb1").checked) {
                    chart.depth3D = 0;
                    chart.angle = 0;
                } else {
                    chart.depth3D = 25;
                    chart.angle = 30;
                }
                chart.validateNow();
            }
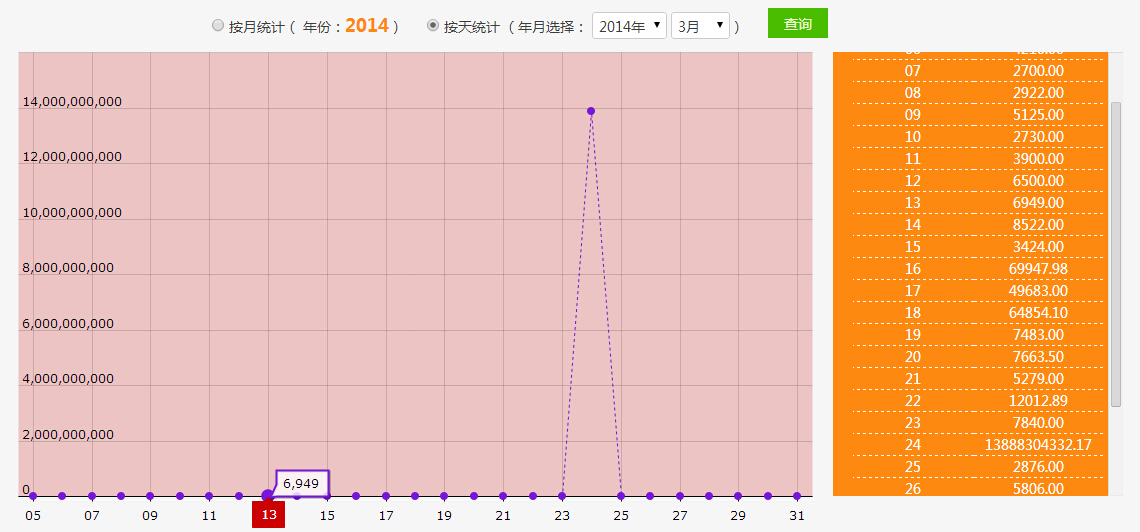
折线图:
    var chart;
    var chartData = <?=$o?>;
AmCharts.ready(function () {
           // SERIAL CHART
    chart = new AmCharts.AmSerialChart();
    chart.pathToImages = "__IMG__/amcharts/images/";
    chart.marginLeft = 20;
    chart.marginRight = 20;
    chart.marginTop = 20;
    chart.dataProvider = chartData;
    chart.categoryField = "month";

    // AXES
    // category
    var categoryAxis = chart.categoryAxis;
    categoryAxis.parseDates = false; // as our data is date-based, we set parseDates to true
    categoryAxis.minPeriod = "MM"; // our data is daily, so we set minPeriod to DD
    // value axis
    var valueAxis = new AmCharts.ValueAxis();
    valueAxis.inside = true;
    valueAxis.tickLength = 0;
    valueAxis.axisAlpha = 0;
    //valueAxis.minimum = 0;
    //valueAxis.maximum = 100000000;
    chart.addValueAxis(valueAxis);

    // GRAPH
    var graph = new AmCharts.AmGraph();
    graph.dashLength = 3;
    graph.lineColor = "#7717D7";
    graph.valueField = "usum";
    graph.dashLength = 3;
    graph.bullet = "round";
    chart.addGraph(graph);

    // CURSOR
    var chartCursor = new AmCharts.ChartCursor();
    chartCursor.cursorAlpha = 0;
    chart.addChartCursor(chartCursor);

    // GUIDES are used to create horizontal range fills
    var guide = new AmCharts.Guide();
    guide.value = 0;
    guide.toValue = 1000000000000;
    guide.fillColor = "#CC0000";
    guide.fillAlpha = 0.2;
    guide.lineAlpha = 0;
    valueAxis.addGuide(guide);
    // WRITE
    chart.write("chartdiv");
});
    // this method sets chart 2D/3D
    function setDepth() {
        if (document.getElementById("rb1").checked) {
            chart.depth3D = 0;
            chart.angle = 0;
        } else {
            chart.depth3D = 25;
            chart.angle = 30;
        }
        chart.validateNow();
    }
amcharts 插件要用到的文件:
amcharts.js amcharts图片文件夹(如下)