Pyecharts是由Echarts而来,Echarts是百度开源的数据可视化的库,适合用来做图表设计开发,当使用Python与Echarts结合时就产生了Pyecharts。可使用pip安装,默认是最新版本的Pyecharts,查看安装的版本号可以使用pycharts.__version__查看。
安装###
现在安装的v1版本与以前的0.5版本是不兼容的,使用方法上存在较大的差异,并且v0.5版本对Python的支持在Python2.7和3.4+的版本上,v1版本支持最新的Python版本。所以网上的很多关于Pyecharts的代码在新版本上并不适用,安装命令:pin install pyecharts
链式调用###
可以使用链式调用的方法来创建一个图表
from pyecharts.charts import Bar
from pyecharts import options as opts
bar= (
  Bar()
  .add_xaxis(["裤子", "高跟鞋", "袜子"])
  .add_yaxis(["销售额"],[300,509,300])
  .set_global_opts(title_opts=opts.TitleOpts(title="主标题", subtitle="副标题"))

)
bar.render()
上述代码中我们可以加入主题:
from pyecharts.globals import ThemeType
Bar(init_opts.IninOpts(theme=ThemeType.LTGHT))
图形绘制###
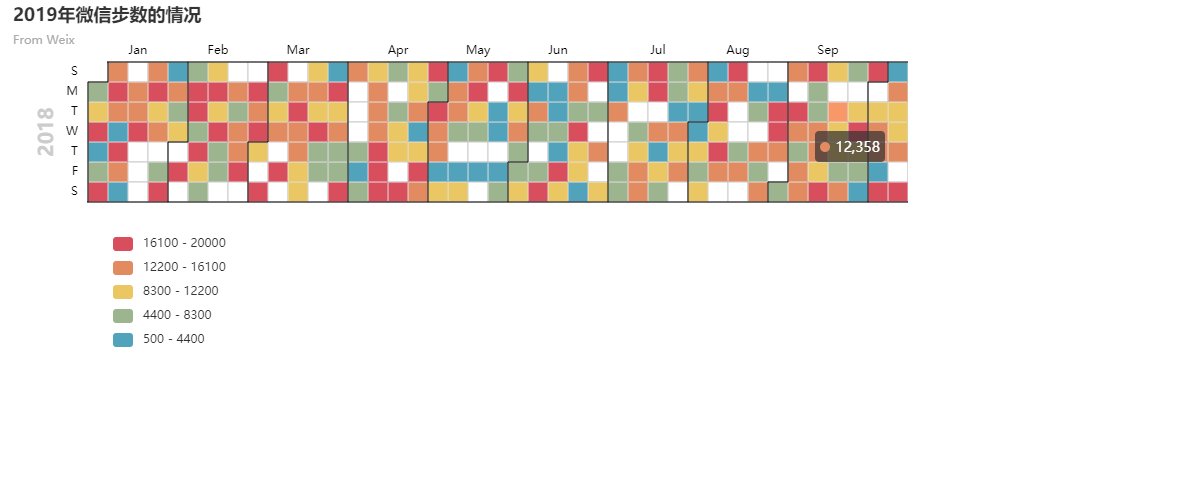
日历图####
Calendar可以用来显示日历图,timedelta用来设置日期间的间隔。具体代码如下
import datetime
import random
from pyecharts import options as opts
from pyecharts.charts import Calendar
def calendar_base() -> Calendar:
 begin = datetime.date(2018, 1, 1) #设置起始日期
 end = datetime.date(2019, 12, 31) #设置终止日期
 data =[
    [str(begin + datetime.timedelta(days=i)), random.randint(1000, 25000)] #设置日期间隔,步数范围
    for i in range((end - begin).days + 1)
     ]
 c = (
    Calendar()
    .add('', data, calendar_opts=opts.CalendarOpts(range_='2019')) #添加到日历图,指定显示2019年数据

    .set_global_opts(          #设置底部显示条,解释数据
        title_opts=opts.TitleOpts(title='2019年微信步数的情况',subtitle='From Weix'),
        visualmap_opts=opts.VisualMapOpts(
            max_=20000,
            min_=500,
            orient='vertical',  #设置垂直显示
            pos_top='230px',
            pos_left='100px',
            is_piecewise=True    #是否连续
         )

     )
 )
 return  c.render('charts1.html')
calendar_base()
运行结果:
漏斗图####
使用Funnel创建一个漏斗图
from pyecharts.faker import Faker
from pyecharts import options as opts
from pyecharts.charts import Funnel, Page


def funnel_base() -> Funnel:
    c = (
        Funnel()
        .add("商品", [list(z) for z in zip(Faker.choose(), Faker.values())], label_opts=opts.LabelOpts(position="inside"))
        .set_global_opts(title_opts=opts.TitleOpts(title="Funnel-基本示例"))
    )
    return c.render('charts2.html')
funnel_base()
运行结果:

这里使用的Faker,它是python的一个第三方模块,主要用来创建一些测试用的随机数据。
Faken使用文档地址:https://faker.readthedocs.io/en/master/index.html
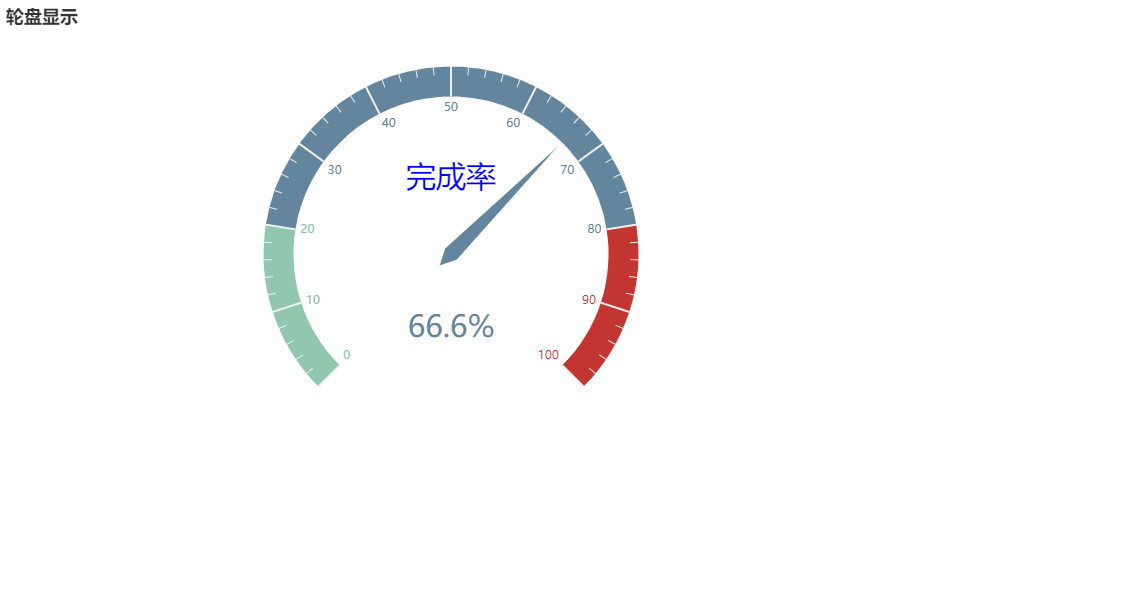
轮盘####
from pyecharts import options as opts
from pyecharts.charts import Gauge, Page

def gauge_label_title_setting() -> Gauge:
    c = (
        Gauge()
        .add(
            "",
            [("完成率", 66.6)],
            title_label_opts=opts.LabelOpts(
                font_size=30, color="blue", font_family="Microsoft YaHei"
            ),
        )
        .set_global_opts(title_opts=opts.TitleOpts(title="轮盘显示"))
    )
    return c.render('charts3.html')
gauge_label_title_setting()
运行结果:
节点图####
import json
import os
from pyecharts import options as opts
from pyecharts.charts import Graph, Page

def graph_base() -> Graph:
    nodes = [
        {'name': '天王星', 'symbolSize': 30},
        {'name': '金星', 'symbolSize': 20},
        {'name': '木星', 'symbolSize': 60},
        {'name': '水星', 'symbolSize': 40},
        {'name': '月球', 'symbolSize': 10},
        {'name': '地球', 'symbolSize': 20}

    ]
    links = []
    for i in nodes:
        for j in nodes:
            links.append({'source': i.get('name'), 'target': j.get('name')})

    c = (
        Graph()
        .add('', nodes, links, repulsion=8000)
        .set_global_opts(title_opts=opts.TitleOpts(title='节点图'))
    )
    return c.render('charts4.html')
graph_base()
运行结果:

其中也可以设置固定点的连接,修改代码如下:
        opts.GraphLink(source="结点1", target="结点2"),
        opts.GraphLink(source="结点2", target="结点3"),
        opts.GraphLink(source="结点3", target="结点4"),
        opts.GraphLink(source="结点4", target="结点5"),
        opts.GraphLink(source="结点5", target="结点1"),
水球图####
from pyecharts import options as opts
from pyecharts.charts import Liquid, Page
from pyecharts.globals import SymbolType


def liquid_base() -> Liquid:
    c = (
        Liquid()
        .add("lq", [0.6, 0.7])
        .set_global_opts(title_opts=opts.TitleOpts(title="Liquid-基本示例"))
    )
    return c.render('charts5.html')
liquid_base()
运行结果:

波浪颜色。
color: Optional[Sequence[str]] = None
是否显示波浪动画。
is_animation: bool = True
是否显示边框。
is_outline_show: bool = True
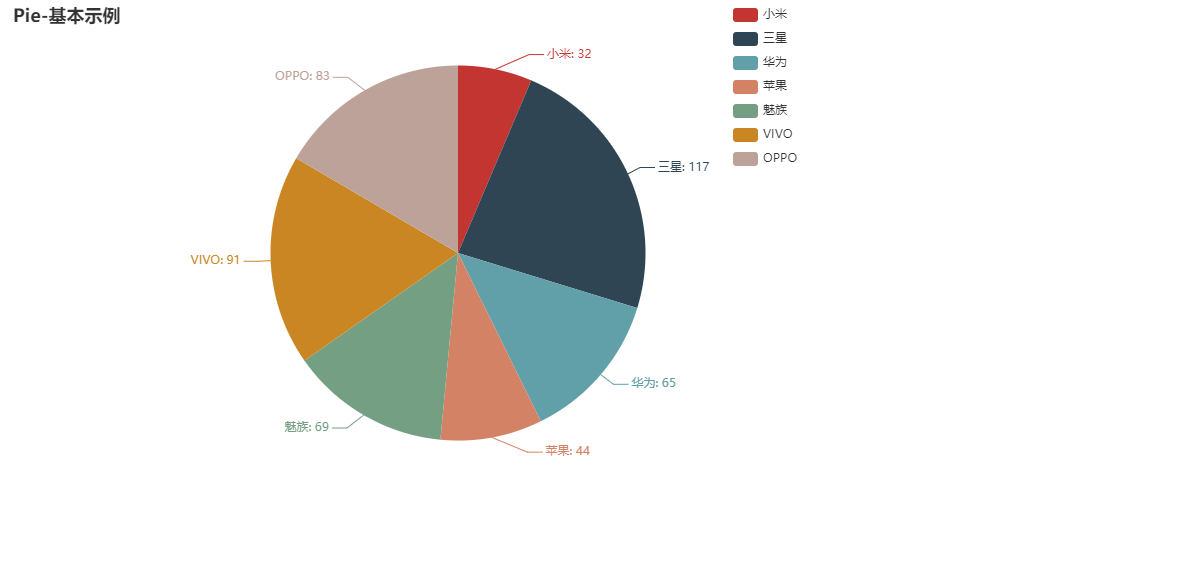
饼状图####
from pyecharts.faker import Faker
from pyecharts import options as opts
from pyecharts.charts import Pie


def pie_base() -> Pie:
    c = (
        Pie()
        .add("", [list(z) for z in zip(Faker.choose(), Faker.values())])
        .set_global_opts(title_opts=opts.TitleOpts(title="Pie-基本示例"),
                         legend_opts=opts.LegendOpts(
                             type_="scroll", pos_left="80%", orient="vertical"
                         )
                         )
        .set_series_opts(label_opts=opts.LabelOpts(formatter="{b}: {c}"))
    )
    return c.render('charts6.html')
pie_base()
运行结果: