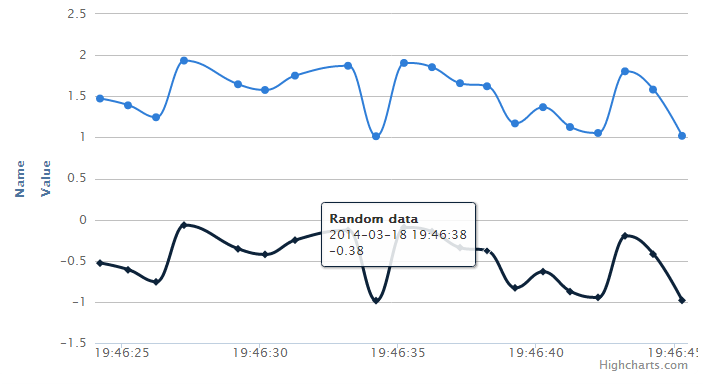
zoukankan      html  css  js  c++  java
  • Highcharts 多个Y轴动态刷新数据

    效果图:

    js代码:

    $(function() {
        $(document).ready(function() {
            Highcharts.setOptions({
                global: {
                    useUTC: false
                }
            });
            var chart;
            chart = new Highcharts.Chart({
                chart: {
                    renderTo: 'container',
                    type: 'spline',
                    animation: Highcharts.svg,
                    // don't animate in old IE               
                    marginRight: 10,
                    events: {
                        load: function() {}
                    }
                },
                title: {
                    text: 'Live random data'
                },
                xAxis: {
                    type: 'datetime',
                    tickPixelInterval: 150
                },
                yAxis: [{
                    title: {
                        text: 'Value'
                    },
                    plotLines: [{
                        value: 0,
                         1,
                        color: '#808080'
                    }]
                },
                {
                    title: {
                        text: 'Name'
                    },
                    plotLines: [{
                        value: 0,
                         1,
                        color: '#808080'
                    }]
                }],
                tooltip: {
                    formatter: function() {
                        return '<b>' + this.series.name + '</b><br/>' + Highcharts.dateFormat('%Y-%m-%d %H:%M:%S', this.x) + '<br/>' + Highcharts.numberFormat(this.y, 2);
                    }
                },
                legend: {
                    enabled: false
                },
                exporting: {
                    enabled: false
                },
                series: [{
                    name: 'Random data',
                    data: (function() { // generate an array of random data                             
                        var data = [],
                        time = (new Date()).getTime(),
                        i;
                        for (i = -19; i <= 0; i++) {
                            data.push({
                                x: time + i * 1000,
                                y: Math.random()
                            });
                        }
                        return data;
                    })()
                },
                {
                    name: 'Random data',
                    data: (function() { // generate an array of random data                             
                        var data = [],
                        time = (new Date()).getTime(),
                        i;
                        for (i = -19; i <= 0; i++) {
                            data.push({
                                x: time + i * 1000,
                                y: Math.random()
                            });
                        }
                        return data;
                    })()
                }]
            }); // set up the updating of the chart each second                     
            var series = chart.series[0];
            var series1 = chart.series[1];
            setInterval(function() {
                var x = (new Date()).getTime(),
                // current time         
                y = Math.random();
                series.addPoint([x, y + 1], true, true);
                series1.addPoint([x, y - 1], true, true);
            },
            1000);
        });
    });

    html代码:

    <head>
      <script type="text/javascript" src="js/jquery.min.js"></script>
      <script type="text/javascript" src="js/highcharts.js"></script>
      <script type="text/javascript" src="js/exporting.js"></script>
      <script>
        //左侧Javascript代码
      </script>
    </head>
    <body>
      <div id="container" style="min-700px;height:400px"></div>
    </body>
  • 相关阅读:
    c++趣味之难以发现的bug
    解决html5 canvas 绘制字体、图片与图形模糊问题
    c++趣味之shared_ptr额外好处
    标准mysql(x64) Windows版安装过程
    解决Chrome与jQuery菜单兼容问题
    在Linux与Windows上获取当前堆栈信息
    TypeScript技巧集锦(陆续更新)
    c++趣味之变量名,颠覆所有教科书的VisualStudio
    Web前端:博客美化:三、右上角的Github Ribbon
    Web前端:博客美化:二、鼠标特效
  • 原文地址:https://www.cnblogs.com/sydeveloper/p/3608588.html
Copyright © 2011-2022 走看看