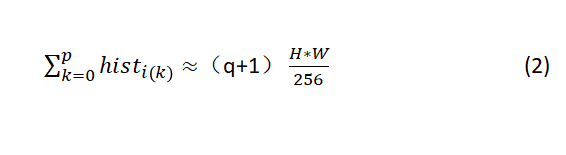
图像为I,宽为W,高为H,hist_i代表I的灰度直方图,hist_i(k)代表灰度值等于k的像素点个数,其中k∈[0,255]。全局直方图均衡化操作是对图像I进行改变,使得输出图像O的灰度直方图hist_o是“平”的,即每一个灰度级的像素点个数是“相等”的(可为约等),即hist_o(k)≈H*W/256,k∈[0,255],那么对于任意的灰度级p,0≤p≤255,总能找到q,0≤q≤255,使得:

将hist_o(k)≈H*W/256带入(1)中,得:
化简为:
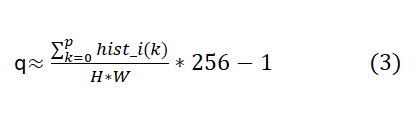
最终公式变为:
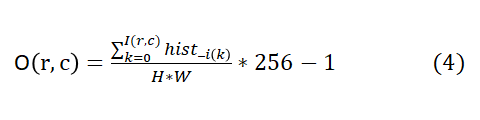
其中H与W为图像的高与宽。
可根据此公式对图像进行全局直方图均衡化。
import math
import numpy as np
import cv2 as cv
import matplotlib.pyplot as plt
# img=cv.imread('4.bmp',2)
img=cv.imread('3.jpg',2)
cv.imshow('original_img',img)
H,W=img.shape
O=np.zeros((H,W))
print(img.shape)
gray=cv.calcHist([img],[0],None,[256],[0,256])
# 计算累加灰度直方图
gray_accumulate=np.zeros([256],np.int)
for i in range(256):
if i ==0:
gray_accumulate[i]=gray[0]
else:
gray_accumulate[i]=gray[i]+gray_accumulate[i-1]
O_out = np.zeros([256],np.uint8)
for i in range(256):
q = gray_accumulate[i]*256/(H*W)-1 # 此处可以帮助理解公式
if q >= 0:
O_out[i] = math.floor(q)
else:
O_out[i] = 0
hist_img = np.zeros(img.shape,np.uint8)
for r in range(H):
for c in range(W):
hist_img[r][c] = O_out[img[r][c]] # 此处可以帮助理解公式
print(O_out)
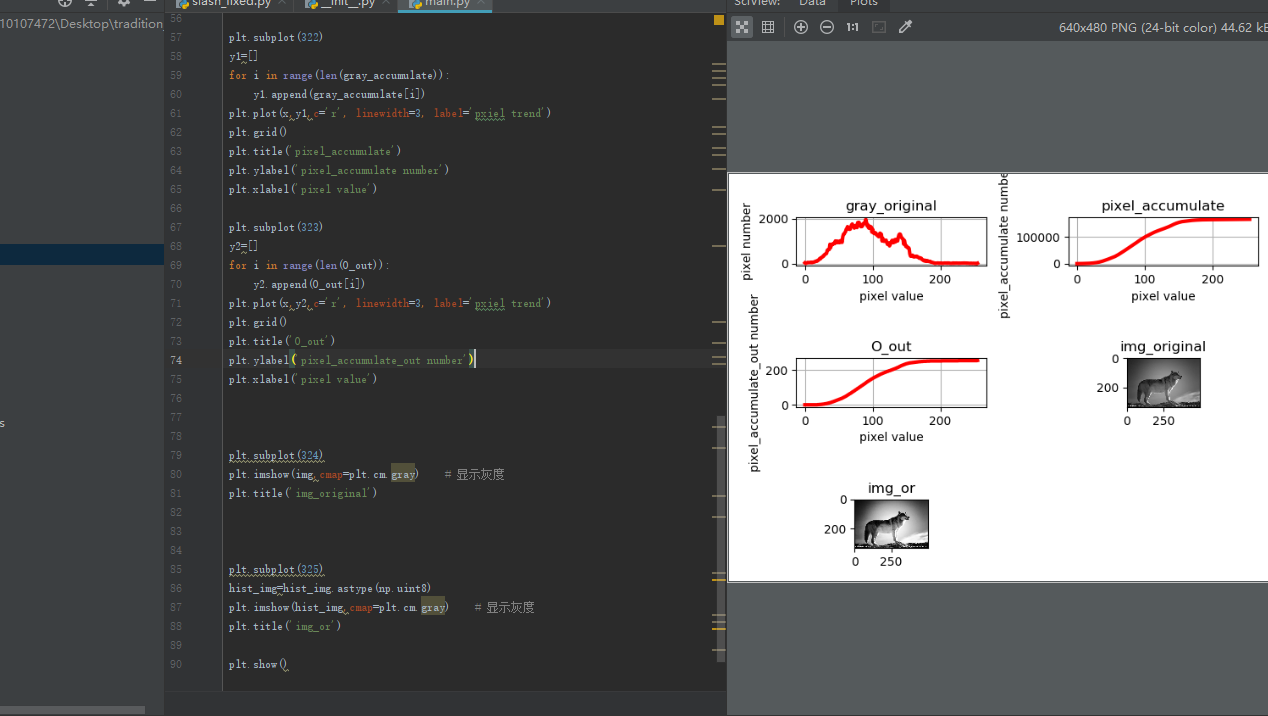
x = [float(i) for i in range(0,256)]
# fig = plt.figure(1)
plt.subplot(321)
y=[]
for i in range(len(gray)):
y.append(gray[i,0])
plt.plot(x,y,c='r', linewidth=3, label='pxiel trend')
# plt.legend(loc='upper left')
plt.grid()
plt.title('gray_original')
plt.ylabel('pixel number')
plt.xlabel('pixel value')
plt.subplot(322)
y1=[]
for i in range(len(gray_accumulate)):
y1.append(gray_accumulate[i])
plt.plot(x,y1,c='r', linewidth=3, label='pxiel trend')
plt.grid()
plt.title('pixel_accumulate')
plt.ylabel('pixel_accumulate number')
plt.xlabel('pixel value')
plt.subplot(323)
y2=[]
for i in range(len(O_out)):
y2.append(O_out[i])
plt.plot(x,y2,c='r', linewidth=3, label='pxiel trend')
plt.grid()
plt.title('O_out')
plt.ylabel('pixel_accumulate_out number')
plt.xlabel('pixel value')
plt.subplot(324)
plt.imshow(img,cmap=plt.cm.gray) # 显示灰度
plt.title('img_original')
plt.subplot(325)
hist_img=hist_img.astype(np.uint8)
plt.imshow(hist_img,cmap=plt.cm.gray) # 显示灰度
plt.title('img_or')
plt.show()