原文链接:http://tecdat.cn/?p=8003
演示数据集
library(gapminder)
head(gapminder)
## # A tibble: 6 x 6
## country continent year lifeExp pop gdpPercap
## <fct> <fct> <int> <dbl> <int> <dbl>
## 1 Afghanistan Asia 1952 28.8 8425333 779.
## 2 Afghanistan Asia 1957 30.3 9240934 821.
## 3 Afghanistan Asia 1962 32.0 10267083 853.
## 4 Afghanistan Asia 1967 34.0 11537966 836.
## 5 Afghanistan Asia 1972 36.1 13079460 740.
## 6 Afghanistan Asia 1977 38.4 14880372 786.静态图
p <- ggplot(
  gapminder,
  aes(x = gdpPercap, y=lifeExp, size = pop, colour = country)
  ) +
  geom_point(show.legend = FALSE, alpha = 0.7) +
  scale_color_viridis_d() +
  scale_size(range = c(2, 12)) +
  scale_x_log10() +
  labs(x = "GDP per capita", y = "Life expectancy")
p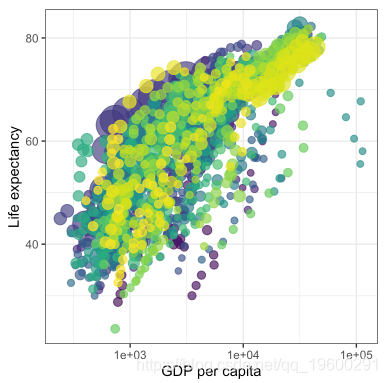
![]()
基本
状态之间的过渡长度将设置为与它们之间的实际时间差相对应。
标签变量:frame_time。给出当前帧所对应的时间。
![]()
创建面:
![]()
让视图跟随数据在每帧中
![]()
逐步衰减
![]()
显示原始数据作为背景
您可以根据需要显示过去和/或将来的原始数据并设置其样式。

![]()
静态图
p <- ggplot(
  airquality,
  aes(Day, Temp, group = Month, color = factor(Month))
  ) +
  geom_line() +
  scale_color_viridis_d() +
  labs(x = "Day of Month", y = "Temperature") +
  theme(legend.position = "top")
p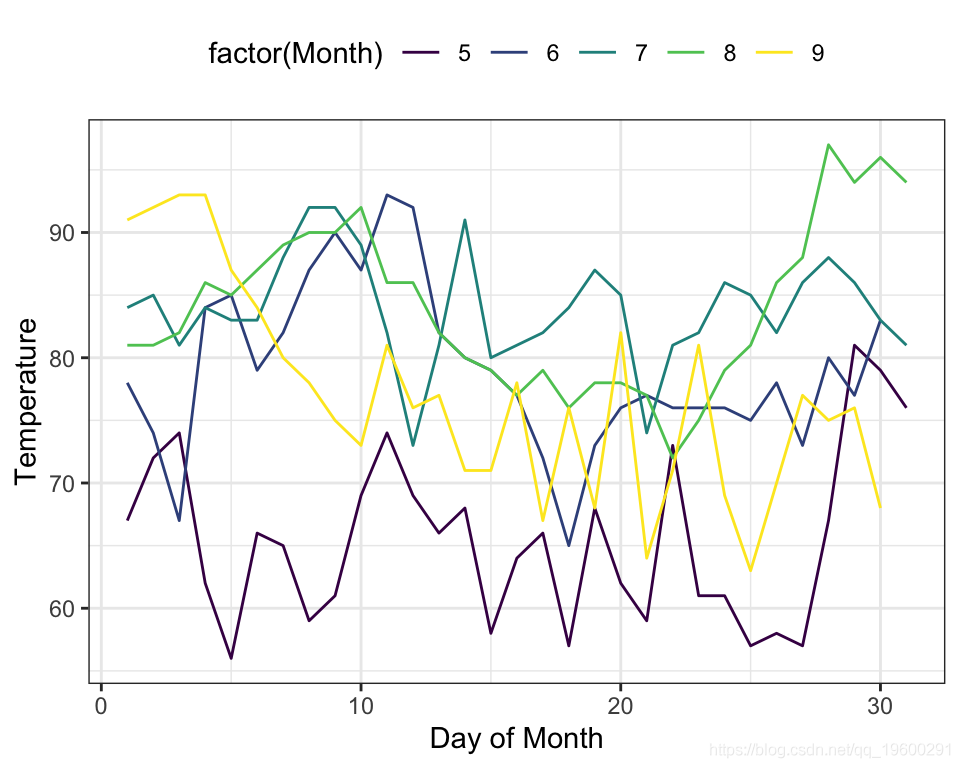
![]()
让数据逐渐出现
- 按天显示(x轴)
![]()

![]()
![]()
在数据的几个不同阶段之间进行转换
数据准备:
library(dplyr)
mean.temp <- airquality %>%
  group_by(Month) %>%
  summarise(Temp = mean(Temp))
mean.temp
## # A tibble: 5 x 2
## Month Temp
## <int> <dbl>
## 1 5 65.5
## 2 6 79.1
## 3 7 83.9
## 4 8 84.0
## 5 9 76.9创建平均温度的条形图:
p <- ggplot(mean.temp, aes(Month, Temp, fill = Temp)) +
  geom_col() +
  scale_fill_distiller(palette = "Reds", direction = 1) +
  theme_minimal() +
  theme(
    panel.grid = element_blank(),
    panel.grid.major.y = element_line(color = "white"),
    panel.ontop = TRUE
  )
p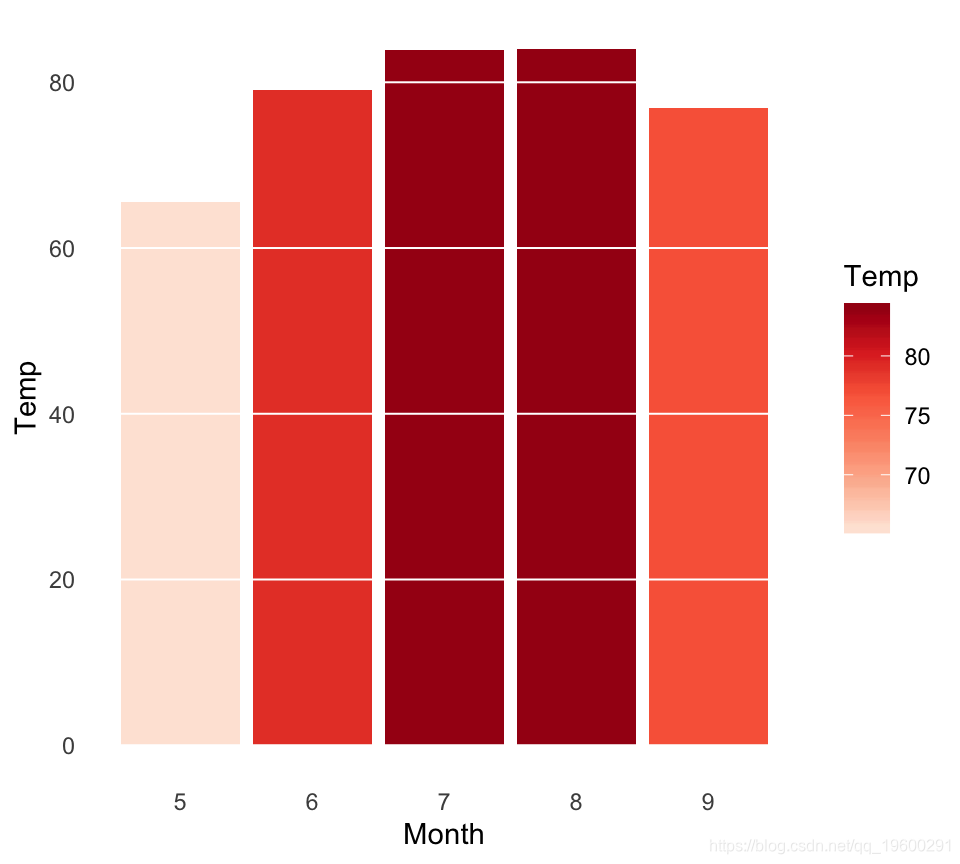
![]()
- transition_states():
![]()
- enter_grow()+ enter_fade()
保存动画
如果需要保存动画以备后用,可以使用该anim_save()功能。