原文链接:http://tecdat.cn/?p=11878
在先前我们提供了Nelson-Siegel模型收敛失败的示例,我们已经展示了它的一些缺陷。
蒙特卡洛模拟帮助我们理解:
for(j in 1:N_SIMULATIONS)

{

    oldYields = NSrates(pp, MATURITY_BASES)

    newYields = oldYields + rnorm(N_MAT, rep(0.0, N_MAT), VOLAs)

    newMATs = MATURITY_BASES - 1.0/365 #next day all mats become 1 day shorter

    pp = Nelson.Siegel(newYields, newMATs)

    newNsYields = NSrates(pp, newMATs)


    npo = c(newYields, oldYields)

    plot(MATURITY_BASES, oldYields, ylim=c(min(npo), max(npo)))

    lines(MATURITY_BASES, oldYields)

    points(MATURITY_BASES, newYields, col="red", pch=4)

    points(newMATs, newNsYields, col="blue")

    lines(newMATs, newNsYields, col="blue")


    oldYieldsArray[j,] = as.numeric(oldYields)

    newYieldsArray[j,] = as.numeric(newYields)

    newNsYieldsArray[j,] = as.numeric(newNsYields)

    maxDistanceArray[j] = max( abs(oldYieldsArray[j,] - newNsYieldsArray[j,]) )

    relativeMaxDistanceArray[j] =  maxDistanceArray[j] / max(abs(oldYieldsArray[j,]))

    paramArray[j,] = as.numeric(pp)

}


plot(density(maxDistanceArray))

plot(density(log(maxDistanceArray)))

idx=which.max(maxDistanceArray)

maxDistanceArray[which.max(maxDistanceArray)]

relativeMaxDistanceArray[which.max(relativeMaxDistanceArray)]
我们要做的是:我们从一些收益率曲线开始,然后逐步地随机修改收益率,最后尝试拟合NS模型以新的收益。因此我们对此进行了模拟。
请注意,对于Nelson-Siegel模型,此Monte-Carlo模拟在某种意义上是“仁慈的”,因为我们始终假定前一步的收益(旧收益率) 与NS曲线完全匹配。但是,即使如此仁慈也无法完全避免麻烦。我们如何发现这些麻烦?在每一步中,我们计算两条相邻曲线之间的最大距离(supremum-norm):
maxDistanceArray[j] = max( abs(oldYieldsArray[j,] - newNsYieldsArray[j,]) )
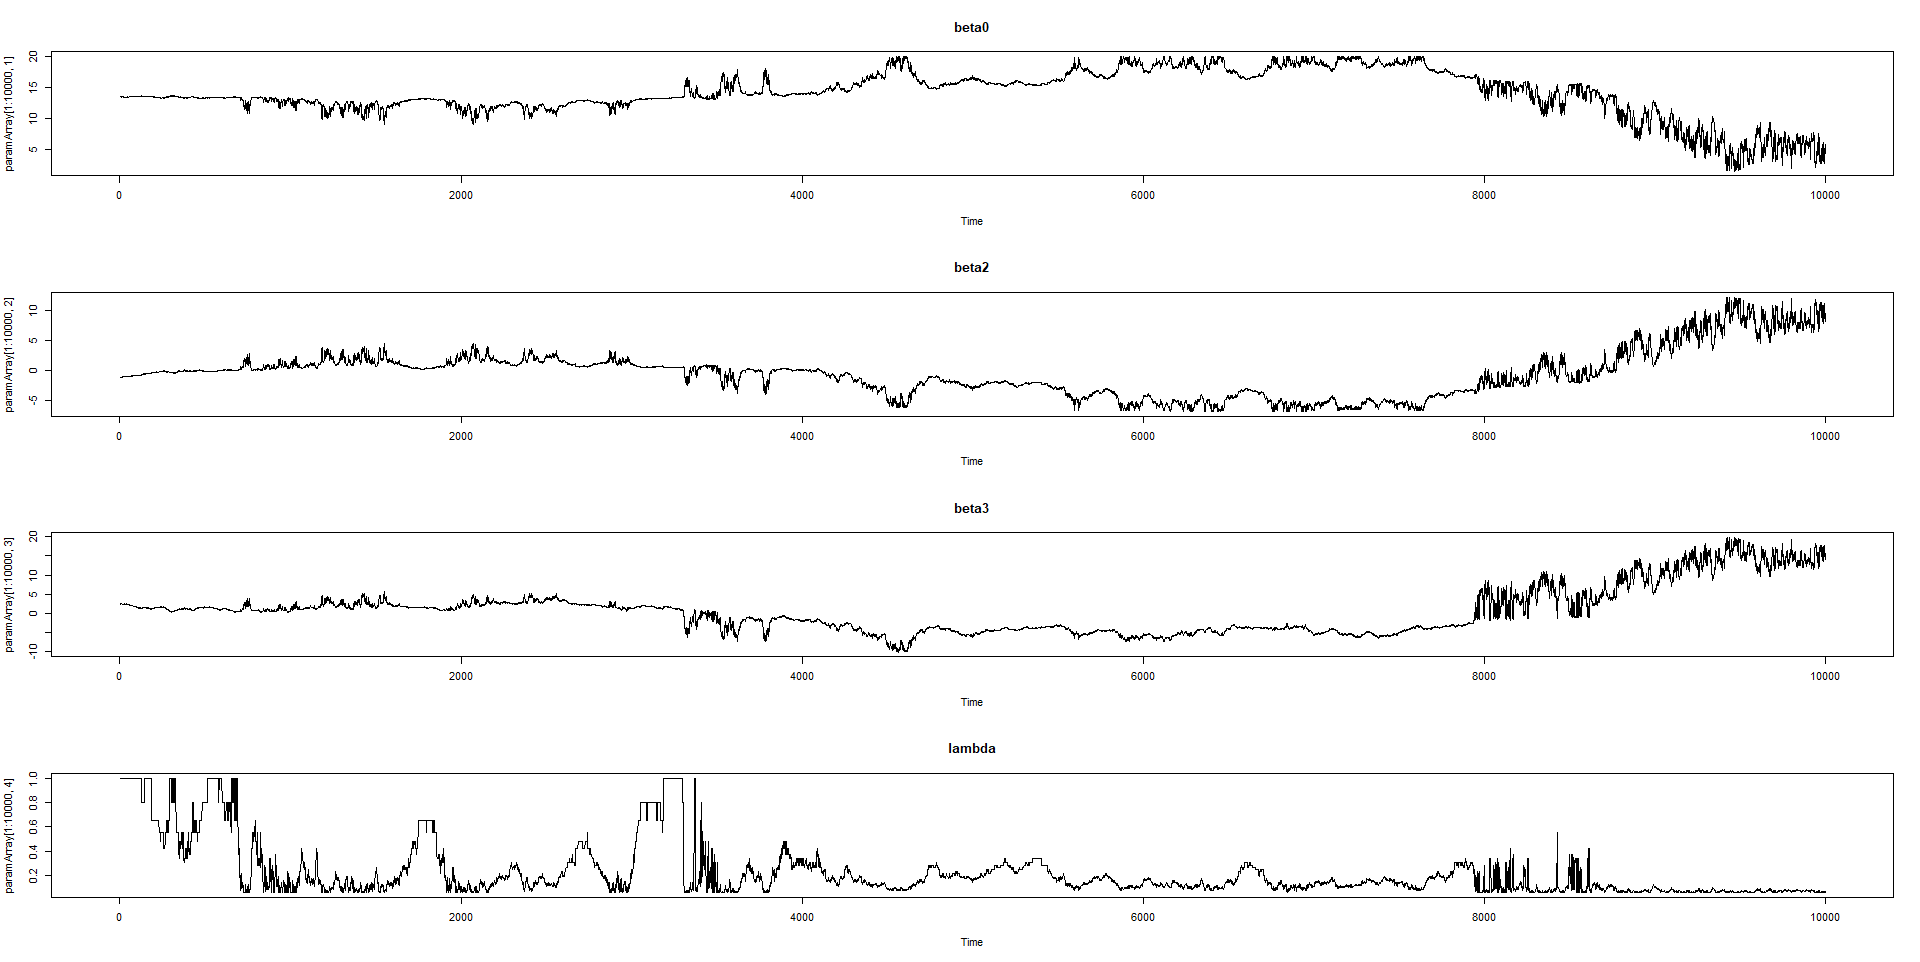
最后,我们仅找到到上一条曲线的最大距离的步骤,这就是收敛失败的示例。
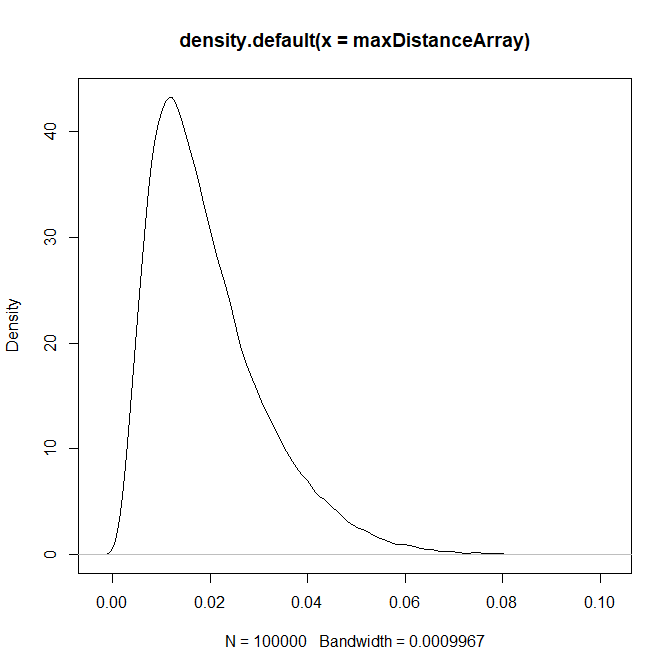
好的,发现问题了,但是该怎么办呢?maxDistanceArray的概率密度 如下所示:![]()
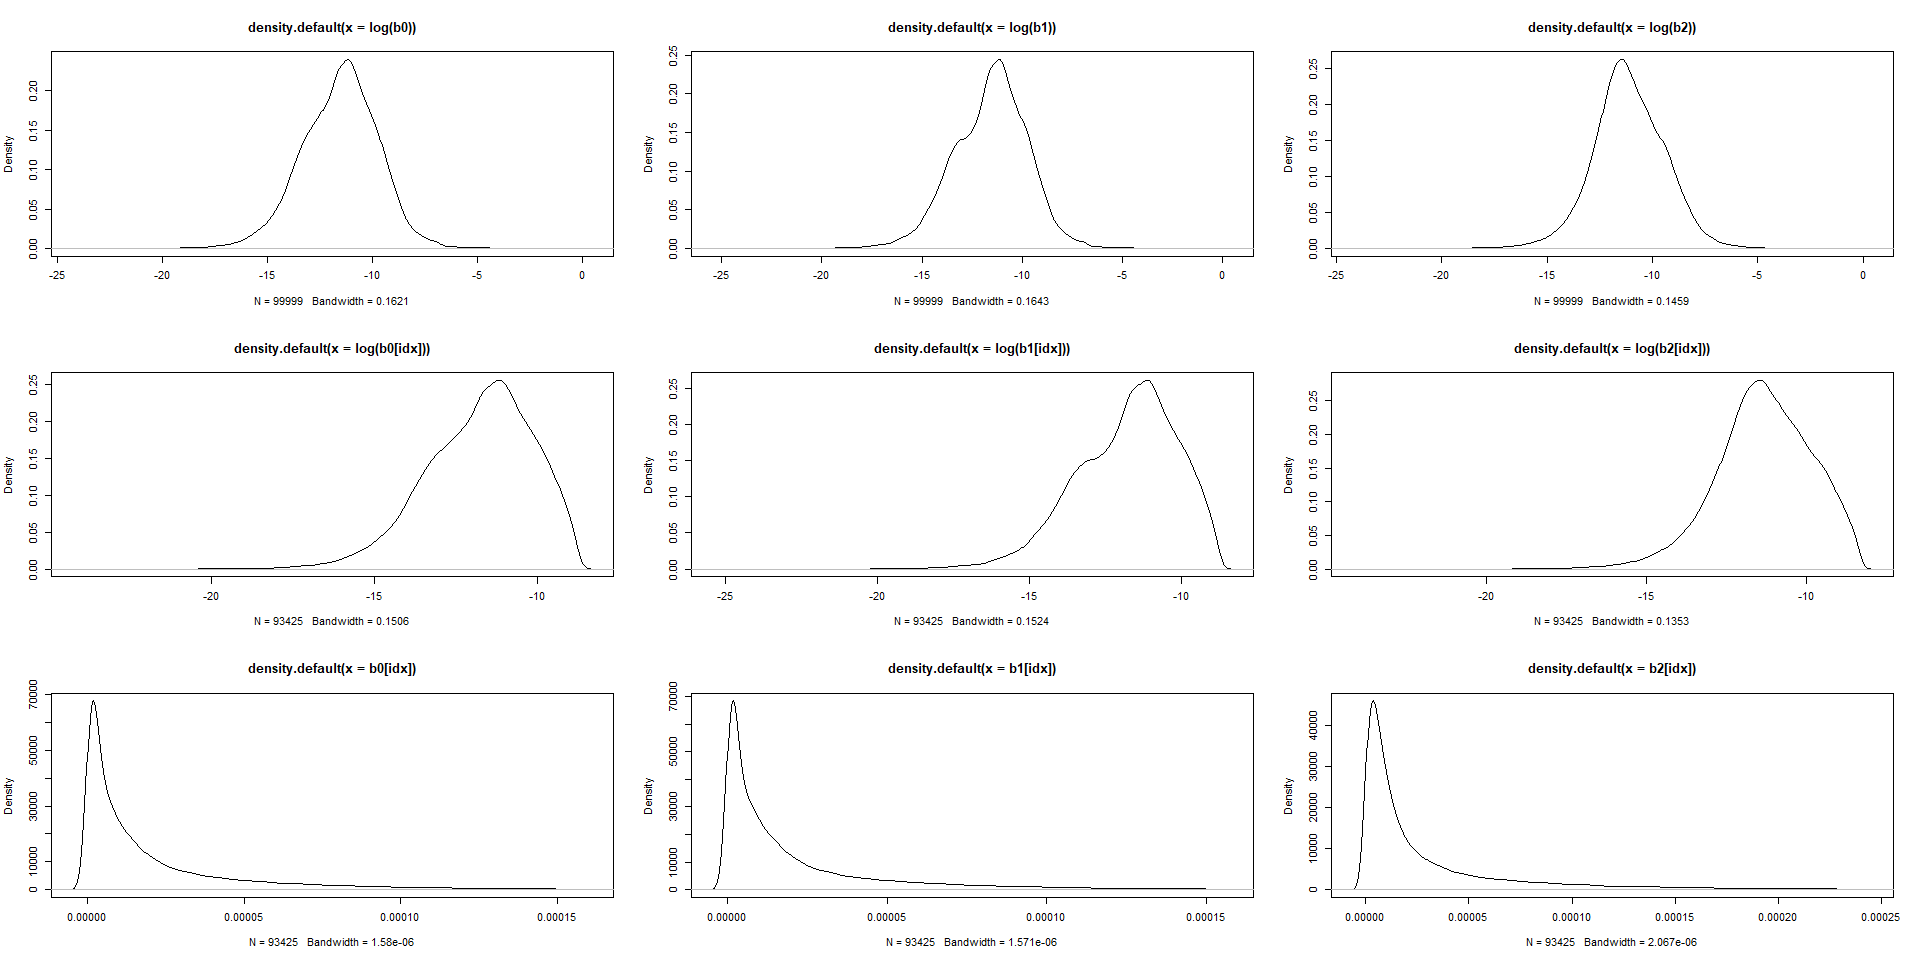
分布尾部在视觉上在0.08处减小,但对于收益率曲线而言,每天偏移8个基点并不罕见。因此,尽管我们进行了1e5 = 10000蒙特卡洛模拟,但只有极少数情况,我们可以将其标记为不良。训练神经网络绝对是不够的。而且,正如我们之前指出的那样,两条Nelson-Siegel曲线可能彼此非常接近,但其参数却彼此远离。由于模型是线性的, 因此有可能假设beta的极大变化(例如,超过95个位数)是异常值,并将其标记为不良。![]()
idx = intersect(intersect(which(b0 < q_b0), which(b1 < q_b1)), which(b2 < q_b2))

par(mfrow=c(3,3))

plot(density(log(b0)))

plot(density(log(b1)))

plot(density(log(b2)))

plot(density(log(b0[idx])))

plot(density(log(b1[idx])))

plot(density(log(b2[idx])))

plot(density(b0[idx]))

plot(density(b1[idx]))

plot(density(b2[idx]))


#de-mean

b0 = b0-mean(b0)

b1 = b1-mean(b1)

b2 = b2-mean(b2)


#train neural network

X = cbind(b0, b1, b2)

Y = array(0, dim=(N_SIMULATIONS-1))

Y[idx] = 1![]()
然后我们可以训练神经网络
SPLT = 0.8
library(keras)
b = floor(SPLT*(N_SIMULATIONS-1))
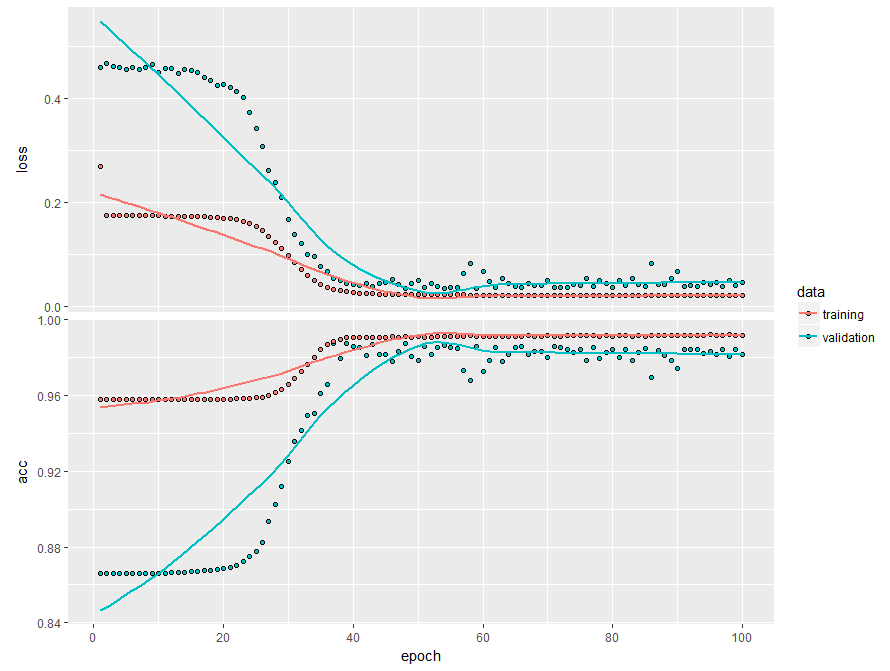
plot(history)
model %>% evaluate(x_test, y_test)![]()
神经网络不仅在样本中而且在验证集上都提供了高精度。
如果模拟新数据集,例如VOLAs = 0.005*sqrt(MATURITY_BASES) , VOLAs = 0.05*sqrt(MATURITY_BASES) 对模型进行修改 将无法识别新数据集上的不良情况。
不足与展望:尽管我们在两种情况下均对数据进行了归一化和平均化,但是模型波动性的线性变化对尾部分位数具有很高的非线性影响。
那么,我们是否需要一个更复杂的AI模型?