原文链接:http://tecdat.cn/?p=2841
此示例显示MATLAB如何从复合条件均值和方差模型预测 和条件差异。
步骤1加载数据并拟合模型
加载工具箱附带的纳斯达克数据。将条件均值和方差模型拟合到数据中。
-
-
nasdaq = DataTable.NASDAQ;
-
r = price2ret(nasdaq);
-
N = length(r);
-
-
model = arima('ARLa gs' 1,'Variance',garch(1,1),...
-
'Distrib ution','t');
-
fit = estimate(mode ,r,'Variance0',{'Constant0',0.001});
-
-
ARIMA(1,0,0) Model (t Distribution):
-
-
Value StandardError TStatistic PValue
-
_________ _____________ __________ __________
-
-
Constant 0.0012326 0.00018163 6.786 1.1528e-11
-
AR{1} 0.066389 0.021398 3.1026 0.0019182
-
DoF 14.839 2.2588 6.5693 5.0539e-11
-
-
-
-
GARCH(1,1) Conditional Variance Model (t Distribution):
-
-
Value StandardError TStatistic PValue
-
__________ _____________ __________ __________
-
-
Constant 3.4488e-06 8.3938e-07 4.1087 3.9788e-05
-
GARCH{1} 0.82904 0.015535 53.365 0
-
ARCH{1} 0.16048 0.016331 9.8268 8.6333e-23
-
DoF 14.839 2.2588 6.5693 5.0539e-11
-
[E0,V0] = infer(fit,r);
第2步预测收益和条件差异
使用forecast计算回报状语从句:条件方差为1000周期的未来视界的MMSE预测。使用观察到的回报和推断残差以及条件方差作为预采样数据。
-
[Y,YMS E,V] = forecast(fit, 100 0,'Y 0',r,'E0', E0, 'V0' ,V0);
-
upper = Y + 1.96*sqrt(YMSE);
-
lower = Y - 1.96*sqrt(YMSE);
-
-
figure
-
subplot(2,1,1)
-
plot(r,'Color',[.75,.75,.75])
-
hold on
-
plot(N+1:N+1000,Y,'r','LineWidth',2)
-
plot(N+1:N+1000,[upper,lower],'k--','LineWidth',1.5)
-
xlim([0,N+1000])
-
title('Forecasted Returns')
-
hold off
-
subplot(2,1,2)
-
plot(V0,'Color',[.75,.75,.75])
-
hold on
-
plot(N+1:N+1000,V,'r','LineWidth',2);
-
xlim([0,N+1000])
-
title('Forecasted Conditional Variances')
-
hold off
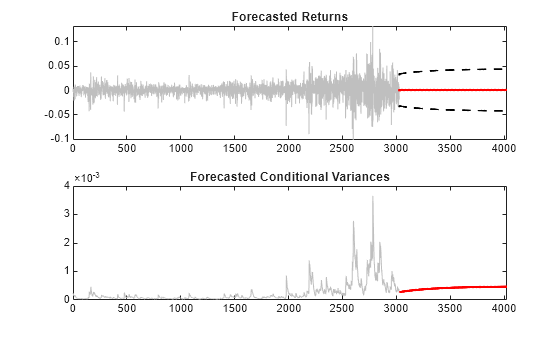
条件方差预测收敛于GARCH条件方差模型的渐近方差。预测的收益收敛于估计的模型常数(AR条件均值模型的无条件均值)。