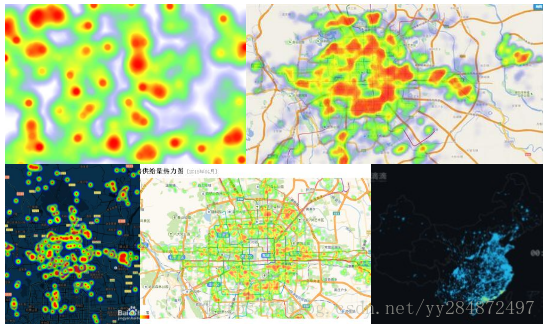
一 、热力图定义
热力图(heat map)也称热图,是以特殊颜色高亮区域的形式表示密度、温度、气压、频率等分布的不易理解和表达的数据。
二、HeatmapRenderer
esri/renderers/HeatmapRenderer类用来快速绘制热力图,将要素图层点数据渲染为强调更高密度或加权值区域的栅格可视化效果。构造函数为:
new HeatmapRenderer(options)
options包括:
圆半径blurRadius;
一组渲染器渐变颜色字符串colors,该属性是必需的;
加权heatmap点的属性名称field;
最大像素强度值maxPixelIntensity;
最小像素强度值minPixelIntensity。
colors:CSS颜色字符串数组(#RGB,#RRGGBB,rgb(r,g,b),rgba(r,g,b,a)),颜色数组至少需要2个元素,即渲染器将使用的颜色渐变,例如:
colors: ["rgba(0, 0, 255, 0)","rgb(0, 0, 255)","rgb(255, 0, 255)", "rgb(255, 0, 0)"]
1
除了使用颜色字符串外,还可以使用colorStops对象来定义渐变颜色。其形式如下代码所示,ratio用来设置各渐变颜色的比率。
colorStops: [
{ ratio: 0, color: "rgba(250, 0, 0, 0)" },
{ ratio: 0.6, color: "rgb(250, 0, 0)" },
{ ratio: 0.85, color: "rgb(250, 150, 0)"},
{ ratio: 0.95, color: "rgb(255, 255, 0)"}
]
1
2
3
4
5
6
HeatmapRenderer类的方法:
设置渲染半径: setBlurRadius(blurRadius)
设置用于插入渲染器颜色渐变的颜色: setColors(colors)
设置渲染器用于确定权重的属性字段: setField(field)
三、完整代码
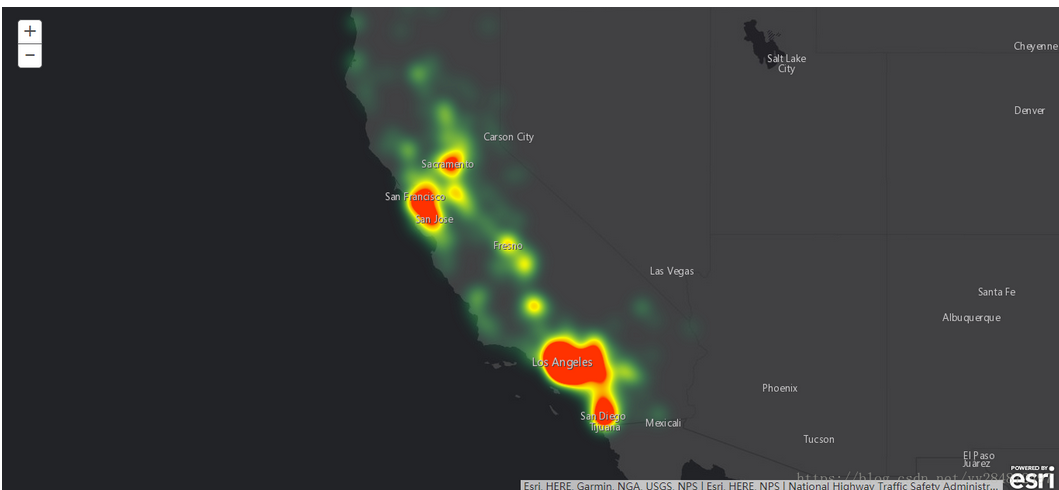
下图为2012年加利福尼亚州涉及超速的致命交通事故点分布图,其中红色高亮地区为事故高发地段。
<!DOCTYPE html>
<html>
<head>
<meta http-equiv="Content-Type" content="text/html; charset=utf-8">
<meta name="viewport" content="initial-scale=1, maximum-scale=1, user-scalable=no">
<title>热力图</title>
<link rel="stylesheet" type="text/css" href="http://localhost/arcgis_js_api/library/3.17/3.17/dijit/themes/claro/claro.css" />
<link rel="stylesheet" type="text/css" href="http://localhost/arcgis_js_api/library/3.17/3.17/esri/css/esri.css" />
<script type="text/javascript" src="http://localhost/arcgis_js_api/library/3.17/3.17/init.js"></script>
<style>
html, body, #map {
100%;
height: 100%;
margin: 0;
padding: 0;
}
</style>
<script>
var map;
require([
"esri/map",
"esri/layers/FeatureLayer",
"esri/renderers/HeatmapRenderer",
"dojo/on",
"dojo/domReady!"],
function (Map, FeatureLayer, HeatmapRenderer, on){
map = new Map("map", {
basemap: "dark-gray",
center: [-119.11, 36.65],
zoom: 6
});
//初始化要素图层
var heatmapFeatureLayer = new FeatureLayer("https://services.arcgis.com/V6ZHFr6zdgNZuVG0/arcgis/rest/services/2012_CA_NHTSA/FeatureServer/0", {
mode: FeatureLayer.MODE_SNAPSHOT,
outFields: [
"atmcond",
"numfatal",
"conszone",
"age",
"alcres",
"sex"
]
});
//热力图渲染器
var heatmapRenderer = new HeatmapRenderer({
blurRadius: 10,
colorStops: [
{ ratio: 0, color: "rgba(0, 255, 150, 0)" },
{ ratio: 0.6, color: "rgb(250, 250, 0)" },
{ ratio: 0.85, color: "rgb(250, 150, 0)"},
{ ratio: 0.95, color: "rgb(255, 50, 0)"}],
});
heatmapFeatureLayer.setRenderer(heatmapRenderer);
map.addLayer(heatmapFeatureLayer);
});
</script>
</head>
<body>
<div id="map"></div>
</body>
</html>
---------------------
作者:佯佯Youngth
来源:CSDN
原文:https://blog.csdn.net/yy284872497/article/details/82977693
版权声明:本文为博主原创文章,转载请附上博文链接!