http://blog.csdn.net/gisshixisheng/article/details/40711075
在做项目的时候,碰见了这样一个问题:给地图上标注点对象,数据是从数据库来的,包含XY坐标信息的,通过graphic和graphiclayer 的方式添加到地图上,其中有一个对象的数量很多,上万了吧,通过上述的方式无法在地图上进行展示,就想到了聚类,当时由于技术和时间的关系,没有实现,最近,稍微有点先下时间,就又想起这事,继续研究,终于,皇天不负有心人,出来了,出来的第一时间写出来,以便大家使用。
首先,看看实现后的效果:
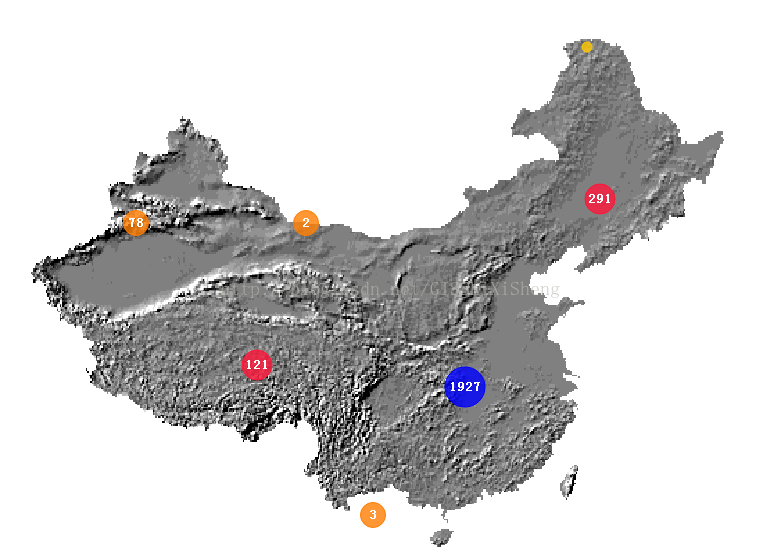
初始化状态
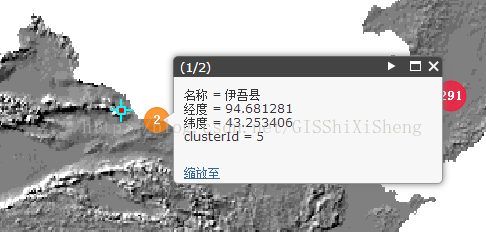

点击对象显示详细对象和信息框

放大后的效果
效果就是上面所示的这个样子的,下面说说实现的步骤与思路:
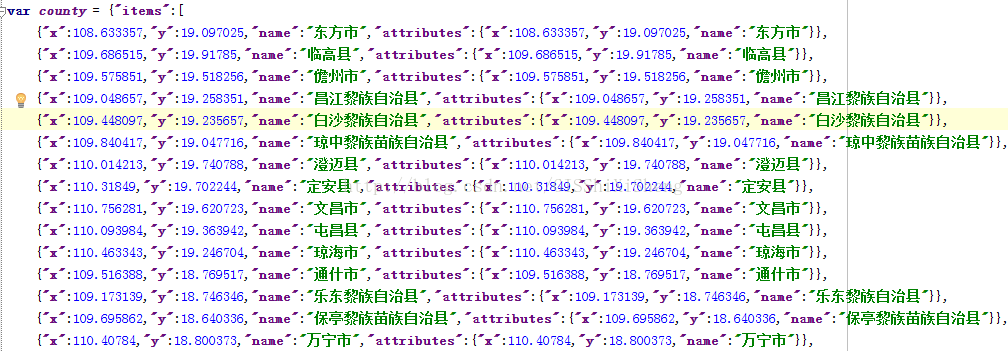
1、数据
正常数据的来源是源自数据库的JSON数据,在本例子中,新建了一个变量用来模拟JSON数据,我所用的数据是全国的市县级的点状数据转换来的,如下:
2、clusterLayer的封装
根据需求,对GraphicsLayer进行了封装为clusterLayer,来源为Arcgis for JS官方实例,对其中个别代码做了修改,源代码如下:
- define([
- "dojo/_base/declare",
- "dojo/_base/array",
- "esri/Color",
- "dojo/_base/connect",
- "esri/SpatialReference",
- "esri/geometry/Point",
- "esri/graphic",
- "esri/symbols/SimpleMarkerSymbol",
- "esri/symbols/TextSymbol",
- "esri/dijit/PopupTemplate",
- "esri/layers/GraphicsLayer"
- ], function (
- declare, arrayUtils, Color, connect,
- SpatialReference, Point, Graphic, SimpleMarkerSymbol, TextSymbol,
- PopupTemplate, GraphicsLayer
- ) {
- return declare([GraphicsLayer], {
- constructor: function(options) {
- // options:
- // data: Object[]
- // Array of objects. Required. Object are required to have properties named x, y and attributes. The x and y coordinates have to be numbers that represent a points coordinates.
- // distance: Number?
- // Optional. The max number of pixels between points to group points in the same cluster. Default value is 50.
- // labelColor: String?
- // Optional. Hex string or array of rgba values used as the color for cluster labels. Default value is #fff (white).
- // labelOffset: String?
- // Optional. Number of pixels to shift a cluster label vertically. Defaults to -5 to align labels with circle symbols. Does not work in IE.
- // resolution: Number
- // Required. Width of a pixel in map coordinates. Example of how to calculate:
- // map.extent.getWidth() / map.width
- // showSingles: Boolean?
- // Optional. Whether or graphics should be displayed when a cluster graphic is clicked. Default is true.
- // singleSymbol: MarkerSymbol?
- // Marker Symbol (picture or simple). Optional. Symbol to use for graphics that represent single points. Default is a small gray SimpleMarkerSymbol.
- // singleTemplate: PopupTemplate?
- // PopupTemplate</a>. Optional. Popup template used to format attributes for graphics that represent single points. Default shows all attributes as "attribute = value" (not recommended).
- // maxSingles: Number?
- // Optional. Threshold for whether or not to show graphics for points in a cluster. Default is 1000.
- // webmap: Boolean?
- // Optional. Whether or not the map is from an ArcGIS.com webmap. Default is false.
- // spatialReference: SpatialReference?
- // Optional. Spatial reference for all graphics in the layer. This has to match the spatial reference of the map. Default is 102100. Omit this if the map uses basemaps in web mercator.
- this._clusterTolerance = options.distance || 50;
- this._clusterData = options.data || [];
- this._clusters = [];
- this._clusterLabelColor = options.labelColor || "#000";
- // labelOffset can be zero so handle it differently
- this._clusterLabelOffset = (options.hasOwnProperty("labelOffset")) ? options.labelOffset : -5;
- // graphics that represent a single point
- this._singles = []; // populated when a graphic is clicked
- this._showSingles = options.hasOwnProperty("showSingles") ? options.showSingles : true;
- // symbol for single graphics
- var SMS = SimpleMarkerSymbol;
- this._singleSym = options.singleSymbol || new SMS("circle", 6, null, new Color(options.singleColor));
- this._singleTemplate = options.singleTemplate || new PopupTemplate({ "title": "", "description": "{*}" });
- this._maxSingles = options.maxSingles || 1000;
- this._webmap = options.hasOwnProperty("webmap") ? options.webmap : false;
- this._sr = options.spatialReference || new SpatialReference({ "wkid": 102100 });
- this._zoomEnd = null;
- },
- // override esri/layers/GraphicsLayer methods
- _setMap: function(map, surface) {
- // calculate and set the initial resolution
- this._clusterResolution = map.extent.getWidth() / map.width; // probably a bad default...
- this._clusterGraphics();
- // connect to onZoomEnd so data is re-clustered when zoom level changes
- this._zoomEnd = connect.connect(map, "onZoomEnd", this, function() {
- // update resolution
- this._clusterResolution = this._map.extent.getWidth() / this._map.width;
- this.clear();
- this._clusterGraphics();
- });
- // GraphicsLayer will add its own listener here
- var div = this.inherited(arguments);
- return div;
- },
- _unsetMap: function() {
- this.inherited(arguments);
- connect.disconnect(this._zoomEnd);
- },
- // public ClusterLayer methods
- add: function(p) {
- // Summary: The argument is a data point to be added to an existing cluster. If the data point falls within an existing cluster, it is added to that cluster and the cluster's label is updated. If the new point does not fall within an existing cluster, a new cluster is created.
- //
- // if passed a graphic, use the GraphicsLayer's add method
- if ( p.declaredClass ) {
- this.inherited(arguments);
- return;
- }
- // add the new data to _clusterData so that it's included in clusters
- // when the map level changes
- this._clusterData.push(p);
- var clustered = false;
- // look for an existing cluster for the new point
- for ( var i = 0; i < this._clusters.length; i++ ) {
- var c = this._clusters[i];
- if ( this._clusterTest(p, c) ) {
- // add the point to an existing cluster
- this._clusterAddPoint(p, c);
- // update the cluster's geometry
- this._updateClusterGeometry(c);
- // update the label
- this._updateLabel(c);
- clustered = true;
- break;
- }
- }
- if ( ! clustered ) {
- this._clusterCreate(p);
- p.attributes.clusterCount = 1;
- this._showCluster(p);
- }
- },
- clear: function() {
- // Summary: Remove all clusters and data points.
- this.inherited(arguments);
- this._clusters.length = 0;
- },
- clearSingles: function(singles) {
- // Summary: Remove graphics that represent individual data points.
- var s = singles || this._singles;
- arrayUtils.forEach(s, function(g) {
- this.remove(g);
- }, this);
- this._singles.length = 0;
- },
- onClick: function(e) {
- // remove any previously showing single features
- this.clearSingles(this._singles);
- // find single graphics that make up the cluster that was clicked
- // would be nice to use filter but performance tanks with large arrays in IE
- var singles = [];
- for ( var i = 0, il = this._clusterData.length; i < il; i++) {
- if ( e.graphic.attributes.clusterId == this._clusterData[i].attributes.clusterId ) {
- singles.push(this._clusterData[i]);
- }
- }
- if ( singles.length > this._maxSingles ) {
- alert("Sorry, that cluster contains more than " + this._maxSingles + " points. Zoom in for more detail.");
- return;
- } else {
- // stop the click from bubbling to the map
- e.stopPropagation();
- this._map.infoWindow.show(e.graphic.geometry);
- this._addSingles(singles);
- }
- },
- // internal methods
- _clusterGraphics: function() {
- // first time through, loop through the points
- for ( var j = 0, jl = this._clusterData.length; j < jl; j++ ) {
- // see if the current feature should be added to a cluster
- var point = this._clusterData[j];
- var clustered = false;
- var numClusters = this._clusters.length;
- for ( var i = 0; i < this._clusters.length; i++ ) {
- var c = this._clusters[i];
- if ( this._clusterTest(point, c) ) {
- this._clusterAddPoint(point, c);
- clustered = true;
- break;
- }
- }
- if ( ! clustered ) {
- this._clusterCreate(point);
- }
- }
- this._showAllClusters();
- },
- _clusterTest: function(p, cluster) {
- var distance = (
- Math.sqrt(
- Math.pow((cluster.x - p.x), 2) + Math.pow((cluster.y - p.y), 2)
- ) / this._clusterResolution
- );
- return (distance <= this._clusterTolerance);
- },
- // points passed to clusterAddPoint should be included
- // in an existing cluster
- // also give the point an attribute called clusterId
- // that corresponds to its cluster
- _clusterAddPoint: function(p, cluster) {
- // average in the new point to the cluster geometry
- var count, x, y;
- count = cluster.attributes.clusterCount;
- x = (p.x + (cluster.x * count)) / (count + 1);
- y = (p.y + (cluster.y * count)) / (count + 1);
- cluster.x = x;
- cluster.y = y;
- // build an extent that includes all points in a cluster
- // extents are for debug/testing only...not used by the layer
- if ( p.x < cluster.attributes.extent[0] ) {
- cluster.attributes.extent[0] = p.x;
- } else if ( p.x > cluster.attributes.extent[2] ) {
- cluster.attributes.extent[2] = p.x;
- }
- if ( p.y < cluster.attributes.extent[1] ) {
- cluster.attributes.extent[1] = p.y;
- } else if ( p.y > cluster.attributes.extent[3] ) {
- cluster.attributes.extent[3] = p.y;
- }
- // increment the count
- cluster.attributes.clusterCount++;
- // attributes might not exist
- if ( ! p.hasOwnProperty("attributes") ) {
- p.attributes = {};
- }
- // give the graphic a cluster id
- p.attributes.clusterId = cluster.attributes.clusterId;
- },
- // point passed to clusterCreate isn't within the
- // clustering distance specified for the layer so
- // create a new cluster for it
- _clusterCreate: function(p) {
- var clusterId = this._clusters.length + 1;
- // console.log("cluster create, id is: ", clusterId);
- // p.attributes might be undefined
- if ( ! p.attributes ) {
- p.attributes = {};
- }
- p.attributes.clusterId = clusterId;
- // create the cluster
- var cluster = {
- "x": p.x,
- "y": p.y,
- "attributes" : {
- "clusterCount": 1,
- "clusterId": clusterId,
- "extent": [ p.x, p.y, p.x, p.y ]
- }
- };
- this._clusters.push(cluster);
- },
- _showAllClusters: function() {
- for ( var i = 0, il = this._clusters.length; i < il; i++ ) {
- var c = this._clusters[i];
- this._showCluster(c);
- }
- },
- _showCluster: function(c) {
- var point = new Point(c.x, c.y, this._sr);
- this.add(
- new Graphic(
- point,
- null,
- c.attributes
- )
- );
- // code below is used to not label clusters with a single point
- if ( c.attributes.clusterCount == 1 ) {
- return;
- }
- // show number of points in the cluster
- var font = new esri.symbol.Font()
- .setSize("10pt")
- .setWeight(esri.symbol.Font.WEIGHT_BOLD);
- var label = new TextSymbol(c.attributes.clusterCount)
- .setColor(new Color(this._clusterLabelColor))
- .setOffset(0, this._clusterLabelOffset)
- .setFont(font);
- this.add(
- new Graphic(
- point,
- label,
- c.attributes
- )
- );
- },
- _addSingles: function(singles) {
- // add single graphics to the map
- arrayUtils.forEach(singles, function(p) {
- var g = new Graphic(
- new Point(p.x, p.y, this._sr),
- this._singleSym,
- p.attributes,
- this._singleTemplate
- );
- this._singles.push(g);
- if ( this._showSingles ) {
- this.add(g);
- }
- }, this);
- this._map.infoWindow.setFeatures(this._singles);
- },
- _updateClusterGeometry: function(c) {
- // find the cluster graphic
- var cg = arrayUtils.filter(this.graphics, function(g) {
- return ! g.symbol &&
- g.attributes.clusterId == c.attributes.clusterId;
- });
- if ( cg.length == 1 ) {
- cg[0].geometry.update(c.x, c.y);
- } else {
- console.log("didn't find exactly one cluster geometry to update: ", cg);
- }
- },
- _updateLabel: function(c) {
- // find the existing label
- var label = arrayUtils.filter(this.graphics, function(g) {
- return g.symbol &&
- g.symbol.declaredClass == "esri.symbol.TextSymbol" &&
- g.attributes.clusterId == c.attributes.clusterId;
- });
- if ( label.length == 1 ) {
- // console.log("update label...found: ", label);
- this.remove(label[0]);
- var newLabel = new TextSymbol(c.attributes.clusterCount)
- .setColor(new Color(this._clusterLabelColor))
- .setOffset(0, this._clusterLabelOffset);
- this.add(
- new Graphic(
- new Point(c.x, c.y, this._sr),
- newLabel,
- c.attributes
- )
- );
- // console.log("updated the label");
- } else {
- console.log("didn't find exactly one label: ", label);
- }
- },
- // debug only...never called by the layer
- _clusterMeta: function() {
- // print total number of features
- console.log("Total: ", this._clusterData.length);
- // add up counts and print it
- var count = 0;
- arrayUtils.forEach(this._clusters, function(c) {
- count += c.attributes.clusterCount;
- });
- console.log("In clusters: ", count);
- }
- });
- });
3、ClusterLayer的导入与引用
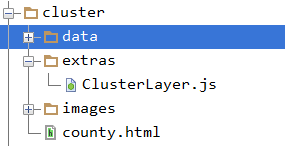
文件目录
如上图所示文件目录,dojo导入的方式为:
- <script>
- // helpful for understanding dojoConfig.packages vs. dojoConfig.paths:
- // http://www.sitepen.com/blog/2013/06/20/dojo-faq-what-is-the-difference-packages-vs-paths-vs-aliases/
- var dojoConfig = {
- paths: {
- extras: location.pathname.replace(//[^/]+$/, "") + "/extras"
- }
- };
- </script>
在代码中引用的代码为:
- require([
- "extras/ClusterLayer"
- ], function(
- ClusterLayer
- ){
- });
4、地图、图层的加载等
完成上述操作,就能去实现聚类了,代码如下:
- parser.parse();
- map = new Map("map", {logo:false,slider: true});
- var tiled = new Tiled("http://localhost:6080/arcgis/rest/services/image/MapServer");
- map.addLayer(tiled,0);
- map.centerAndZoom(new Point(103.847, 36.0473, map.spatialReference),4);
- map.on("load", function() {
- addClusters(county.items);
- });
- function addClusters(items) {
- console.log(items);
- var countyInfo = {};
- countyInfo.data = arrayUtils.map(items, function(item) {
- var latlng = new Point(parseFloat(item.x), parseFloat(item.y), map.spatialReference);
- var webMercator = webMercatorUtils.geographicToWebMercator(latlng);
- var attributes = {
- "名称": item.name,
- "经度": item.x,
- "纬度": item.y
- };
- return {
- "x": webMercator.x,
- "y": webMercator.y,
- "attributes": attributes
- };
- });
- console.log(countyInfo.data);
- // cluster layer that uses OpenLayers style clustering
- clusterLayer = new ClusterLayer({
- "data": countyInfo.data,
- "distance": 150,
- "id": "clusters",
- "labelColor": "#fff",
- "labelOffset": -4,
- "resolution": map.extent.getWidth() / map.width,
- "singleColor": "#f00",
- "maxSingles":3000
- });
- var defaultSym = new SimpleMarkerSymbol().setSize(4);
- var renderer = new ClassBreaksRenderer(defaultSym, "clusterCount");
- /*var picBaseUrl = "images/";
- var blue = new PictureMarkerSymbol(picBaseUrl + "BluePin1LargeB.png", 32, 32).setOffset(0, 15);
- var green = new PictureMarkerSymbol(picBaseUrl + "GreenPin1LargeB.png", 64, 64).setOffset(0, 15);
- var red = new PictureMarkerSymbol(picBaseUrl + "RedPin1LargeB.png", 80, 80).setOffset(0, 15);*/
- var style1 = new SimpleMarkerSymbol(SimpleMarkerSymbol.STYLE_CIRCLE, 10,
- new SimpleLineSymbol(SimpleLineSymbol.STYLE_SOLID,
- new Color([255,200,0]), 1),
- new Color([255,200,0,0.8]));
- var style2 = new SimpleMarkerSymbol(SimpleMarkerSymbol.STYLE_CIRCLE, 25,
- new SimpleLineSymbol(SimpleLineSymbol.STYLE_SOLID,
- new Color([255,125,3]), 1),
- new Color([255,125,3,0.8]));
- var style3 = new SimpleMarkerSymbol(SimpleMarkerSymbol.STYLE_CIRCLE, 30,
- new SimpleLineSymbol(SimpleLineSymbol.STYLE_SOLID,
- new Color([255,23,58]), 1),
- new Color([255,23,58,0.8]));
- var style4 = new SimpleMarkerSymbol(SimpleMarkerSymbol.STYLE_CIRCLE, 35,
- new SimpleLineSymbol(SimpleLineSymbol.STYLE_SOLID,
- new Color([204,0,184]), 1),
- new Color([204,0,184,0.8]));
- var style5 = new SimpleMarkerSymbol(SimpleMarkerSymbol.STYLE_CIRCLE, 40,
- new SimpleLineSymbol(SimpleLineSymbol.STYLE_SOLID,
- new Color([0,0,255]), 1),
- new Color([0,0,255,0.8]));
- renderer.addBreak(0, 2, style1);
- renderer.addBreak(2, 100, style2);
- renderer.addBreak(100, 500, style3);
- renderer.addBreak(500, 1000, style4);
- renderer.addBreak(1000, 3001, style5);
- clusterLayer.setRenderer(renderer);
- map.addLayer(clusterLayer);
- // close the info window when the map is clicked
- map.on("click", cleanUp);
- // close the info window when esc is pressed
- map.on("key-down", function(e) {
- if (e.keyCode === 27) {
- cleanUp();
- }
- });
- }
- function cleanUp() {
- map.infoWindow.hide();
- clusterLayer.clearSingles();
- }
注:在创建ClusterLayer对象时有以下几个参数,
1、distance
distance控制的是两个点之间的距离,distance值越小,点密度越大,反之亦然;
2、labelColor
labelColor为个数显示的颜色;
3、labelOffset
labelOffset默认值为0,+为向上,-为向下;
4、singleColor
singleColor为单个对象出现时显示的颜色;
5、maxSingles
maxSingles是最多可显示多少个点。
6、resolution
resolution是一个变化的值,当前的地图范围/地图的范围即为resolution;
7、对ClusterLayer进行ClassBreaksRenderer
此处ClassBreaksRenderer的短点的值可按照数据的多少来确定。
cluster.html的源码如下:
- <!doctype html>
- <html>
- <head>
- <meta charset="utf-8">
- <meta name="viewport" content="initial-scale=1, maximum-scale=1,user-scalable=no">
- <title>Cluster</title>
- <link rel="stylesheet" href="http://localhost/arcgis_js_api/library/3.9/3.9/js/dojo/dijit/themes/tundra/tundra.css">
- <link rel="stylesheet" href="http://localhost/arcgis_js_api/library/3.9/3.9/js/esri/css/esri.css">
- <style>
- html, body, #map{ height: 100%; 100%; margin: 0; padding: 0; }
- #map{ margin: 0; padding: 0; }
- </style>
- <script>
- // helpful for understanding dojoConfig.packages vs. dojoConfig.paths:
- // http://www.sitepen.com/blog/2013/06/20/dojo-faq-what-is-the-difference-packages-vs-paths-vs-aliases/
- var dojoConfig = {
- paths: {
- extras: location.pathname.replace(//[^/]+$/, "") + "/extras"
- }
- };
- </script>
- <script src="http://localhost/arcgis_js_api/library/3.9/3.9/init.js"></script>
- <script src="data/county.js"></script>
- <script>
- var map;
- var clusterLayer;
- require([
- "dojo/parser",
- "dojo/_base/array",
- "esri/Color",
- "esri/map",
- "esri/layers/ArcGISTiledMapServiceLayer",
- "esri/request",
- "esri/graphic",
- "esri/geometry/Extent",
- "esri/symbols/SimpleMarkerSymbol",
- "esri/symbols/PictureMarkerSymbol",
- "esri/symbols/SimpleLineSymbol",
- "esri/symbols/SimpleFillSymbol",
- "esri/renderers/ClassBreaksRenderer",
- "esri/layers/GraphicsLayer",
- "esri/SpatialReference",
- "esri/geometry/Point",
- "esri/geometry/webMercatorUtils",
- "extras/ClusterLayer",
- "dojo/domReady!"
- ], function(
- parser,
- arrayUtils,
- Color,
- Map,
- Tiled,
- esriRequest,
- Graphic,
- Extent,
- SimpleMarkerSymbol,
- PictureMarkerSymbol,
- SimpleLineSymbol,
- SimpleFillSymbol,
- ClassBreaksRenderer,
- GraphicsLayer,
- SpatialReference,
- Point,
- webMercatorUtils,
- ClusterLayer
- ){
- parser.parse();
- map = new Map("map", {logo:false,slider: true});
- var tiled = new Tiled("http://localhost:6080/arcgis/rest/services/image/MapServer");
- map.addLayer(tiled,0);
- map.centerAndZoom(new Point(103.847, 36.0473, map.spatialReference),4);
- map.on("load", function() {
- addClusters(county.items);
- });
- function addClusters(items) {
- console.log(items);
- var countyInfo = {};
- countyInfo.data = arrayUtils.map(items, function(item) {
- var latlng = new Point(parseFloat(item.x), parseFloat(item.y), map.spatialReference);
- var webMercator = webMercatorUtils.geographicToWebMercator(latlng);
- var attributes = {
- "名称": item.name,
- "经度": item.x,
- "纬度": item.y
- };
- return {
- "x": webMercator.x,
- "y": webMercator.y,
- "attributes": attributes
- };
- });
- console.log(countyInfo.data);
- // cluster layer that uses OpenLayers style clustering
- clusterLayer = new ClusterLayer({
- "data": countyInfo.data,
- "distance": 150,
- "id": "clusters",
- "labelColor": "#fff",
- "labelOffset": -4,
- "resolution": map.extent.getWidth() / map.width,
- "singleColor": "#f00",
- "maxSingles":3000
- });
- var defaultSym = new SimpleMarkerSymbol().setSize(4);
- var renderer = new ClassBreaksRenderer(defaultSym, "clusterCount");
- /*var picBaseUrl = "images/";
- var blue = new PictureMarkerSymbol(picBaseUrl + "BluePin1LargeB.png", 32, 32).setOffset(0, 15);
- var green = new PictureMarkerSymbol(picBaseUrl + "GreenPin1LargeB.png", 64, 64).setOffset(0, 15);
- var red = new PictureMarkerSymbol(picBaseUrl + "RedPin1LargeB.png", 80, 80).setOffset(0, 15);*/
- var style1 = new SimpleMarkerSymbol(SimpleMarkerSymbol.STYLE_CIRCLE, 10,
- new SimpleLineSymbol(SimpleLineSymbol.STYLE_SOLID,
- new Color([255,200,0]), 1),
- new Color([255,200,0,0.8]));
- var style2 = new SimpleMarkerSymbol(SimpleMarkerSymbol.STYLE_CIRCLE, 25,
- new SimpleLineSymbol(SimpleLineSymbol.STYLE_SOLID,
- new Color([255,125,3]), 1),
- new Color([255,125,3,0.8]));
- var style3 = new SimpleMarkerSymbol(SimpleMarkerSymbol.STYLE_CIRCLE, 30,
- new SimpleLineSymbol(SimpleLineSymbol.STYLE_SOLID,
- new Color([255,23,58]), 1),
- new Color([255,23,58,0.8]));
- var style4 = new SimpleMarkerSymbol(SimpleMarkerSymbol.STYLE_CIRCLE, 35,
- new SimpleLineSymbol(SimpleLineSymbol.STYLE_SOLID,
- new Color([204,0,184]), 1),
- new Color([204,0,184,0.8]));
- var style5 = new SimpleMarkerSymbol(SimpleMarkerSymbol.STYLE_CIRCLE, 40,
- new SimpleLineSymbol(SimpleLineSymbol.STYLE_SOLID,
- new Color([0,0,255]), 1),
- new Color([0,0,255,0.8]));
- renderer.addBreak(0, 2, style1);
- renderer.addBreak(2, 100, style2);
- renderer.addBreak(100, 500, style3);
- renderer.addBreak(500, 1000, style4);
- renderer.addBreak(1000, 3001, style5);
- clusterLayer.setRenderer(renderer);
- map.addLayer(clusterLayer);
- // close the info window when the map is clicked
- map.on("click", cleanUp);
- // close the info window when esc is pressed
- map.on("key-down", function(e) {
- if (e.keyCode === 27) {
- cleanUp();
- }
- });
- }
- function cleanUp() {
- map.infoWindow.hide();
- clusterLayer.clearSingles();
- }
- });
- </script>
- </head>
- <body>
- <div id="map"></div>
- </div>
- </body>
- </html>
欢迎关注LZUGIS CSDN之Arcgis for JS系列文章,有疑问请联系