http://blog.csdn.net/gisshixisheng/article/details/44494715
综述:本节讲述的是用Arcgis for js加载天地图的切片资源。
天地图的切片地图可以通过esri.layers.TiledMapServiceLayer来加载,在此将之进行了一定的封装,如下:
1、切片线划图——TDTLayer.js
- define(["dojo/_base/declare",
- "esri/layers/tiled"],
- function (declare) {
- return declare(esri.layers.TiledMapServiceLayer, {
- constructor: function () {
- this.spatialReference = new esri.SpatialReference({ wkid: 4326 });
- this.initialExtent = (this.fullExtent = new esri.geometry.Extent(-180.0, -90.0, 180.0, 90.0, this.spatialReference));
- this.tileInfo = new esri.layers.TileInfo({
- "rows": 256,
- "cols": 256,
- "compressionQuality": 0,
- "origin": {
- "x": -180,
- "y": 90
- },
- "spatialReference": {
- "wkid": 4326
- },
- "lods": [
- { "level": 2, "resolution": 0.3515625, "scale": 147748796.52937502 },
- { "level": 3, "resolution": 0.17578125, "scale": 73874398.264687508 },
- { "level": 4, "resolution": 0.087890625, "scale": 36937199.132343754 },
- { "level": 5, "resolution": 0.0439453125, "scale": 18468599.566171877 },
- { "level": 6, "resolution": 0.02197265625, "scale": 9234299.7830859385 },
- { "level": 7, "resolution": 0.010986328125, "scale": 4617149.8915429693 },
- { "level": 8, "resolution": 0.0054931640625, "scale": 2308574.9457714846 },
- { "level": 9, "resolution": 0.00274658203125, "scale": 1154287.4728857423 },
- { "level": 10, "resolution": 0.001373291015625, "scale": 577143.73644287116 },
- { "level": 11, "resolution": 0.0006866455078125, "scale": 288571.86822143558 },
- { "level": 12, "resolution": 0.00034332275390625, "scale": 144285.93411071779 },
- { "level": 13, "resolution": 0.000171661376953125, "scale": 72142.967055358895 },
- { "level": 14, "resolution": 8.58306884765625e-005, "scale": 36071.483527679447 },
- { "level": 15, "resolution": 4.291534423828125e-005, "scale": 18035.741763839724 },
- { "level": 16, "resolution": 2.1457672119140625e-005, "scale": 9017.8708819198619 },
- { "level": 17, "resolution": 1.0728836059570313e-005, "scale": 4508.9354409599309 },
- { "level": 18, "resolution": 5.3644180297851563e-006, "scale": 2254.4677204799655 }
- ]
- });
- this.loaded = true;
- this.onLoad(this);
- },
- getTileUrl: function (level, row, col) {
- return "http://t" + col % 8 + ".tianditu.cn/vec_c/wmts?SERVICE=WMTS&REQUEST=GetTile&VERSION=1.0.0&LAYER=vec&STYLE=default&TILEMATRIXSET=c&TILEMATRIX=" + level + "&TILEROW=" + row + "&TILECOL=" + col + "&FORMAT=tiles";
- }
- });
- });
2、切片标注——TDTAnnoLayer.js
- define(["dojo/_base/declare",
- "esri/layers/tiled"],
- function (declare) {
- return declare(esri.layers.TiledMapServiceLayer, {
- constructor: function () {
- this.spatialReference = new esri.SpatialReference({ wkid: 4326 });
- this.initialExtent = (this.fullExtent = new esri.geometry.Extent(-180.0, -90.0, 180.0, 90.0, this.spatialReference));
- this.tileInfo = new esri.layers.TileInfo({
- "rows": 256,
- "cols": 256,
- "compressionQuality": 0,
- "origin": {
- "x": -180,
- "y": 90
- },
- "spatialReference": {
- "wkid": 4326
- },
- "lods": [
- { "level": 2, "resolution": 0.3515625, "scale": 147748796.52937502 },
- { "level": 3, "resolution": 0.17578125, "scale": 73874398.264687508 },
- { "level": 4, "resolution": 0.087890625, "scale": 36937199.132343754 },
- { "level": 5, "resolution": 0.0439453125, "scale": 18468599.566171877 },
- { "level": 6, "resolution": 0.02197265625, "scale": 9234299.7830859385 },
- { "level": 7, "resolution": 0.010986328125, "scale": 4617149.8915429693 },
- { "level": 8, "resolution": 0.0054931640625, "scale": 2308574.9457714846 },
- { "level": 9, "resolution": 0.00274658203125, "scale": 1154287.4728857423 },
- { "level": 10, "resolution": 0.001373291015625, "scale": 577143.73644287116 },
- { "level": 11, "resolution": 0.0006866455078125, "scale": 288571.86822143558 },
- { "level": 12, "resolution": 0.00034332275390625, "scale": 144285.93411071779 },
- { "level": 13, "resolution": 0.000171661376953125, "scale": 72142.967055358895 },
- { "level": 14, "resolution": 8.58306884765625e-005, "scale": 36071.483527679447 },
- { "level": 15, "resolution": 4.291534423828125e-005, "scale": 18035.741763839724 },
- { "level": 16, "resolution": 2.1457672119140625e-005, "scale": 9017.8708819198619 },
- { "level": 17, "resolution": 1.0728836059570313e-005, "scale": 4508.9354409599309 },
- { "level": 18, "resolution": 5.3644180297851563e-006, "scale": 2254.4677204799655 }
- ]
- });
- this.loaded = true;
- this.onLoad(this);
- },
- getTileUrl: function (level, row, col) {
- return "http://t" + row % 8 + ".tianditu.cn/cva_c/wmts?SERVICE=WMTS&REQUEST=GetTile&VERSION=1.0.0&LAYER=cva&STYLE=default&TILEMATRIXSET=c&TILEMATRIX=" + level + "&TILEROW=" + row + "&TILECOL=" + col + "&FORMAT=tiles";
- }
- });
- });
封装好之后就可以在页面调用了,调用的时候需要导入这些自定义的图层,导入方式为:
- <script type="text/javascript">
- dojoConfig = {
- parseOnLoad: true,
- packages: [{
- name: 'tdlib',
- location: this.location.pathname.replace(//[^/]+$/, "")+"/js/tdlib"
- }]
- };
- </script>
- <script src="http://localhost/arcgis_js_api/library/3.9/3.9/init.js"></script>
- <script>
- require(["tdlib/TDTLayer",
- "tdlib/TDTAnnoLayer"],
- function (TDTLayer,
- TDTAnnoLayer
- ){
- var basemap = new TDTLayer();
- map.addLayer(basemap);
- var annolayer = new TDTAnnoLayer();
- map.addLayer(annolayer);
- });
- </script>
完整调用页面代码为:
- <!DOCTYPE html>
- <html>
- <head>
- <meta http-equiv="Content-Type" content="text/html; charset=utf-8" />
- <title>TianDi Map</title>
- <link rel="stylesheet" href="http://localhost/arcgis_js_api/library/3.9/3.9/js/dojo/dijit/themes/tundra/tundra.css">
- <link rel="stylesheet" href="http://localhost/arcgis_js_api/library/3.9/3.9/js/esri/css/esri.css">
- <style>
- html, body, #map {
- height: 100%;
- margin: 0;
- padding: 0;
- }
- </style>
- <script type="text/javascript">
- dojoConfig = {
- parseOnLoad: true,
- packages: [{
- name: 'tdlib',
- location: this.location.pathname.replace(//[^/]+$/, "")+"/js/tdlib"
- }]
- };
- </script>
- <script src="http://localhost/arcgis_js_api/library/3.9/3.9/init.js"></script>
- <script>
- var map;
- require(["esri/map",
- "tdlib/TDTLayer",
- "tdlib/TDTAnnoLayer",
- "esri/layers/FeatureLayer",
- "esri/geometry/Point",
- "esri/symbols/SimpleFillSymbol",
- "esri/symbols/SimpleLineSymbol",
- "dojo/_base/Color",
- "dojo/domReady!"],
- function (Map,
- TDTLayer,
- TDTAnnoLayer,
- FeatureLayer,
- Point,
- SimpleFillSymbol,
- SimpleLineSymbol,
- Color
- ){
- map = new Map("map", { logo: false });
- var basemap = new TDTLayer();
- map.addLayer(basemap);
- var annolayer = new TDTAnnoLayer();
- map.addLayer(annolayer);
- var pro = new FeatureLayer("http://localhost:6080/arcgis/rest/services/chinawgs84/MapServer/1");
- map.addLayer(pro);
- var pt = new Point(103.847, 36.0473);
- map.centerAndZoom(pt, 3);
- });
- </script>
- </head>
- <body>
- <div id="map"></div>
- </body>
- </html>
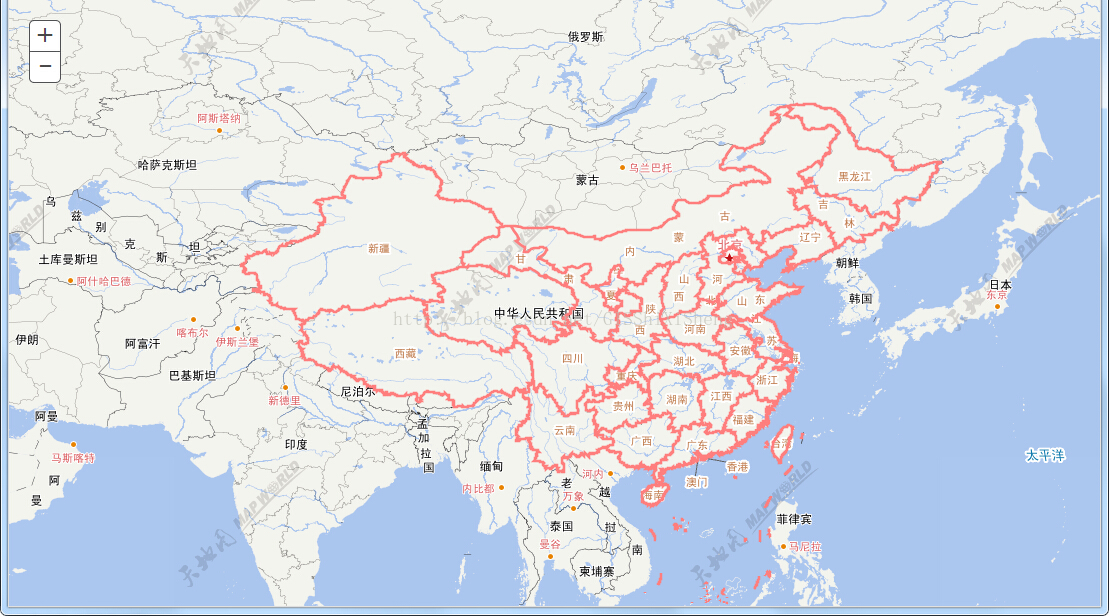
在图中,我还添加了一个我本机用Arcgis Server发布的特征层,完成后效果如下:
本文抛砖引玉,更多的天地图如影像等请参照:http://www.tianditu.com/guide/index.html