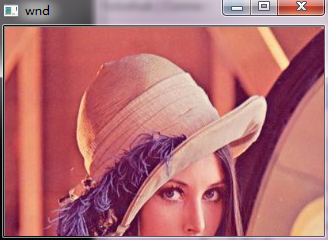
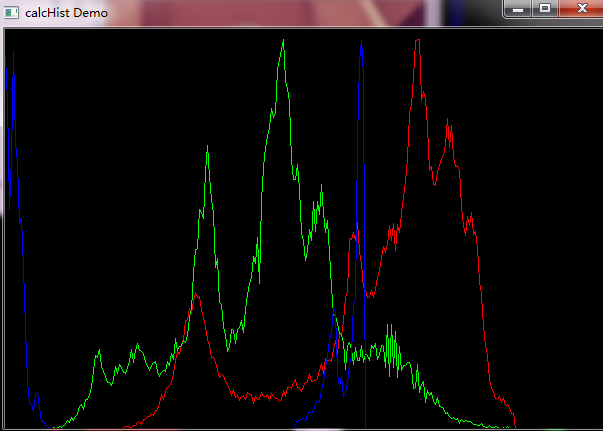
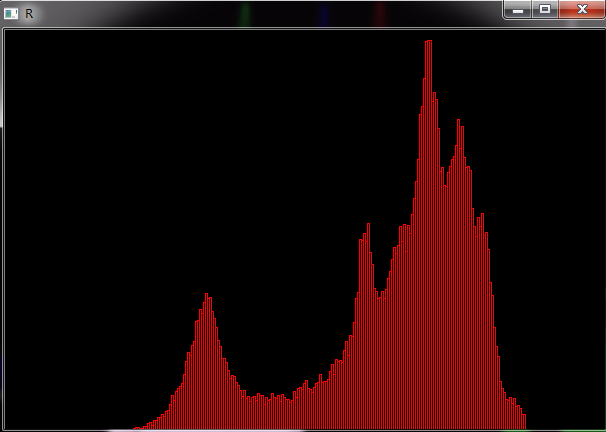
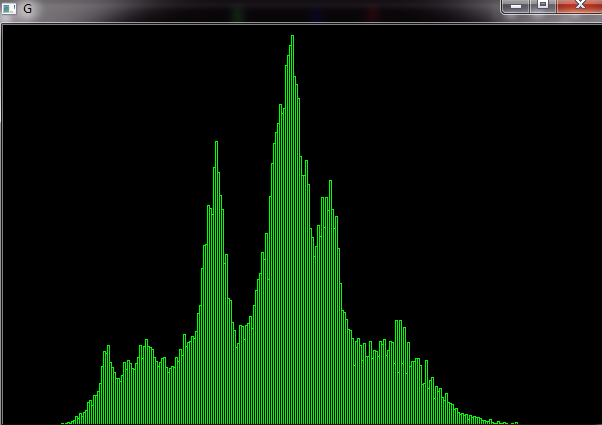
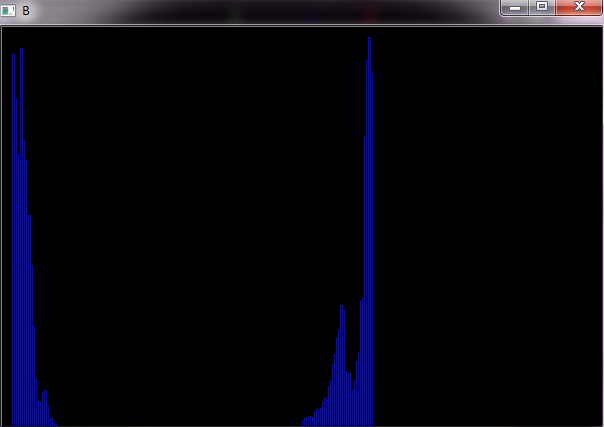
  1 ////////////////////////////////////////////////////////////////////////////////////////////
  2 ////Code Source
  3 ////https://blog.csdn.net/ljbkiss/article/details/7412787
  4 ////https://blog.csdn.net/ljbkiss/article/details/7420429
  5 ////calcHist的使用+lena.jpg图像RGB3通道的normalize的直方图
  6 ////////////////////////////////////////////////////////////////////////////////////////////
  7 #include <opencv2/core/core.hpp>
  8 #include <opencv2/highgui/highgui.hpp>
  9 #include <opencv2/imgproc/imgproc.hpp>
 10 #include <iostream>
 11
 12 //#pragma comment(lib, "opencv_core231d.lib")
 13 //#pragma comment(lib, "opencv_highgui231d.lib")
 14 //#pragma comment(lib, "opencv_imgproc231d.lib")
 15
 16 using namespace cv;
 17 using namespace std;
 18
 19 #define HIST_DIM1
 20
 21 int main(int argc, char** argv)
 22 {
 23 #ifdef HIST_DIM1
 24     //----------------------example 1-------------------------------//
 25     Mat src, dst;
 26     /// Load image
 27     src = imread("d:/lena.jpg");
 28
 29     if (!src.data)
 30     {
 31         cout << "load image failed" << endl;
 32         return -1;
 33     }
 34
 35     /// Separate the image in 3 places ( R, G and B )
 36     vector<Mat> rgb_planes;
 37 #define SHOW_HSV
 38
 39 #ifdef SHOW_HSV
 40     Mat hsv;
 41     cvtColor(src, hsv, COLOR_BGR2HSV);
 42     split(hsv, rgb_planes);
 43 #else
 44     split(src, rgb_planes);
 45 #endif
 46     /// Establish the number of bins
 47     int histSize = 256;
 48
 49     /// Set the ranges ( for R,G,B) )
 50     float range[] = { 0, 255 };
 51     const float* histRange = { range };
 52
 53     bool uniform = true;
 54
 55     bool accumulate = false;
 56
 57     Mat r_hist, g_hist, b_hist;
 58
 59     /// Compute the histograms:
 60     calcHist(&rgb_planes[2], 1, 0, Mat(), r_hist, 1, &histSize, &histRange, uniform, accumulate);
 61     calcHist(&rgb_planes[1], 1, 0, Mat(), g_hist, 1, &histSize, &histRange, uniform, accumulate);
 62     calcHist(&rgb_planes[0], 1, 0, Mat(), b_hist, 1, &histSize, &histRange, uniform, accumulate);
 63
 64     // Draw the histograms for R, G and B
 65     int hist_w = 600;
 66     int hist_h = 400;
 67     int bin_w = cvRound((double)hist_w / histSize);
 68
 69     Mat rgb_hist[3];
 70     for (int i = 0; i<3; ++i)
 71     {
 72         rgb_hist[i] = Mat(hist_h, hist_w, CV_8UC3, Scalar::all(0));
 73     }
 74
 75     Mat histImage(hist_h, hist_w, CV_8UC3, Scalar(0, 0, 0));
 76
 77     /// Normalize the result to [ 0, histImage.rows-10]
 78     normalize(r_hist, r_hist, 0, histImage.rows - 10, NORM_MINMAX);
 79     normalize(g_hist, g_hist, 0, histImage.rows - 10, NORM_MINMAX);
 80     normalize(b_hist, b_hist, 0, histImage.rows - 10, NORM_MINMAX);
 81
 82     /// Draw for each channel in one image
 83     for (int i = 1; i < histSize; i++)
 84     {
 85         line(histImage, Point(bin_w*(i - 1), hist_h - cvRound(r_hist.at<float>(i - 1))),
 86             Point(bin_w*(i), hist_h - cvRound(r_hist.at<float>(i))),
 87             Scalar(0, 0, 255), 1);
 88         line(histImage, Point(bin_w*(i - 1), hist_h - cvRound(g_hist.at<float>(i - 1))),
 89             Point(bin_w*(i), hist_h - cvRound(g_hist.at<float>(i))),
 90             Scalar(0, 255, 0), 1);
 91         line(histImage, Point(bin_w*(i - 1), hist_h - cvRound(b_hist.at<float>(i - 1))),
 92             Point(bin_w*(i), hist_h - cvRound(b_hist.at<float>(i))),
 93             Scalar(255, 0, 0), 1);
 94     }
 95
 96     for (int j = 0; j<histSize; ++j)
 97     {
 98         int val = saturate_cast<int>(r_hist.at<float>(j));
 99         rectangle(rgb_hist[0], Point(j * 2 + 10, rgb_hist[0].rows), Point((j + 1) * 2 + 10, rgb_hist[0].rows - val), Scalar(0, 0, 255), 1, 8);
100
101         val = saturate_cast<int>(g_hist.at<float>(j));
102         rectangle(rgb_hist[1], Point(j * 2 + 10, rgb_hist[1].rows), Point((j + 1) * 2 + 10, rgb_hist[1].rows - val), Scalar(0, 255, 0), 1, 8);
103
104         val = saturate_cast<int>(b_hist.at<float>(j));
105         rectangle(rgb_hist[2], Point(j * 2 + 10, rgb_hist[2].rows), Point((j + 1) * 2 + 10, rgb_hist[2].rows - val), Scalar(255, 0, 0), 1, 8);
106     }
107
108     /// Display
109     namedWindow("calcHist Demo", CV_WINDOW_AUTOSIZE);
110     namedWindow("wnd");
111     imshow("calcHist Demo", histImage);
112     imshow("wnd", src);
113
114     imshow("R", rgb_hist[0]);
115     imshow("G", rgb_hist[1]);
116     imshow("B", rgb_hist[2]);
117 #else
118     //----------------------example 2-------------------------------//
119     Mat src, hsv;
120     if (!(src = imread("d:/picture/lena.bmp")).data)
121         return -1;
122     cvtColor(src, hsv, CV_BGR2HSV);
123     // Quantize the hue to 30 levels
124     // and the saturation to 32 levels
125     int hbins = 60, sbins = 64;
126     int histSize[] = { hbins, sbins };
127     // hue varies from 0 to 179, see cvtColor
128     float hranges[] = { 0, 180 };
129     // saturation varies from 0 (black-gray-white) to
130     // 255 (pure spectrum color)
131     float sranges[] = { 0, 256 };
132     const float*ranges[] = { hranges, sranges };
133     MatND hist;
134     // we compute the histogram from the 0-th and 1-st channels
135     int channels[] = { 0, 1 };
136     calcHist(&hsv, 1, channels, Mat(), hist, 2, histSize, ranges, true, false);
137     double maxVal = 0;
138     minMaxLoc(hist, 0, &maxVal, 0, 0);
139     int scale = 8;
140     Mat histImg = Mat::zeros(sbins*scale, hbins*scale, CV_8UC3);
141     for (int h = 0; h < hbins; h++)
142     {
143         for (int s = 0; s < sbins; s++)
144         {
145             float binVal = hist.at<float>(h, s);
146             int intensity = cvRound(binVal * 255 / maxVal);
147             rectangle(histImg, Point(h*scale, s*scale), Point((h + 1)*scale - 1, (s + 1)*scale - 1), Scalar::all(intensity), CV_FILLED);
148         }
149     }
150     namedWindow("Source", 1);
151     imshow("Source", src);
152     namedWindow("H-S Histogram", 1);
153     imshow("H-S Histogram", histImg);
154 #endif
155     //-------------------------------------------------------------------------//
156     waitKey(0);
157     destroyAllWindows();
158     return 0;
159 }
运行效果: