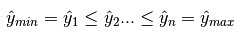
103 保序回归 isotonic regression
1.关于isotonic regression
首先sklearn粘上原贡献者的博客Isotonic Regression http://fa.bianp.net/blog/2013/isotonic-regression/
及Wikipedia上的解释https://en.wikipedia.org/wiki/Isotonic_regression
这种回归,是这一种单调函数的回归,回归模型中后一个x一定比前一个x大,也就是有序,具体的数学公式在上面两个网址中都有。
保序回归并不需要制定的目标函数。
保序回归的应用之一就是用来做统计推断,比如药量和毒性的关系,一般认为毒性随着药量是不减或者递增的关系,借此可以来估计最大药量。
2.部分函数介绍
2.2 sklearn.utils.check_random_state
2.3 sklearn.isotonic.IsotonicRegression
2.4 np.newaxis
2.5 matplotlib.pyplot.gca
Axes 3.代码
-
# Author: Nelle Varoquaux <nelle.varoquaux@gmail.com>
-
# Alexandre Gramfort <alexandre.gramfort@inria.fr>
-
# #copy by IKoala
-
-
import numpy as np
-
import matplotlib.pyplot as plt
-
from matplotlib.collections import LineCollection
-
-
from sklearn.linear_model import LinearRegression
-
from sklearn.isotonic import IsotonicRegression
-
from sklearn.utils import check_random_state
-
-
n = 100
-
x = np.arange(n)
-
rs = check_random_state(333)
-
-
y = rs.randint(-50, 50, size=(n,)) + 50. * np.log(1 + np.arange(n))
-
-
###############################################################################
-
# Fit IsotonicRegression and LinearRegression models
-
#分别用iR、LR拟合
-
-
ir = IsotonicRegression()
-
-
y_ = ir.fit_transform(x, y)
-
-
lr = LinearRegression()
-
-
lr.fit(x[:, np.newaxis], y) # x needs to be 2d for LinearRegression
-
-
###############################################################################
-
# plot result
-
-
segments = [[[i, y[i]], [i, y_[i]]] for i in range(n)]
-
lc = LineCollection(segments, zorder=0)
-
lc.set_array(np.ones(len(y)))#把它变成arange(100)看看啥效果噢
-
lc.set_linewidths(0.5 * np.ones(n))
-
-
fig = plt.figure()
-
plt.plot(x, y, 'r.', markersize=12)
-
plt.plot(x, y_, 'g.-', markersize=12)
-
plt.plot(x, lr.predict(x[:, np.newaxis]), 'b-')
-
plt.gca().add_collection(lc)
-
plt.legend(('Data', 'Isotonic Fit', 'Linear Fit'), loc='lower right')
-
plt.title('Isotonic regression')
-
plt.show()
模型预测结果校准——Isotonic regression
模型预测结果校准——Isotonic regression
方法简介:
Isotonic Regression: the method used by Zadrozny and Elkan (2002; 2001) to calibrate predictions from boosted naive bayes, SVM, and decision tree models.[1]
Zadrozny and Elkan (2002; 2001) successfully used a more general
method based on Isotonic Regression (Robertson et al.,1988) to calibrate predictions from SVMs, Naive Bayes, boosted Naive Bayes, and decision trees. This method is more general in that the only restriction is that the mapping function be isotonic (monotonically increasing).[1]
Isotonic regression(保序回归) 是一种非参数化方法(The non-parametric approach);
假设模型的预测结果记为fi,真实目标记为yi,那么Isotonic Regression的基本假设为:
其中m是isotonic(单调递增)的函数。
给定数据集,可以通过下式求解m:
Isotonic Regression的一种求解算法是pair-adjacent violators algorithm(简称PAV算法),时间复杂度是O(N),主要思想是通过不断合并、调整违反单调性的局部区间,使得最终得到的区间满足单调性。PAV算法也是scikit-learn中isotonic regression库的求解算法。该算法的动态效果图可参阅文献[2]。

One algorithm that finds a stepwise constant solution for the Isotonic Regression problem is pair-adjacent violators (PAV) algorithm (Ayer et al., 1955) presented in Table 1.

Isotonic regression 的通俗化解释:
-
问题描述:给定一个无序数字序列,要求不改变每个元素的位置,但可以修改每个元素的值,修改后得到一个非递减序列,问如何使误差(该处取平方差)最小?
-
保序回归法:从该序列的首元素往后观察,一旦出现乱序现象停止该轮观察,从该乱序元素开始逐个吸收元素组成一个序列,直到该序列所有元素的平均值小于或等于下一个待吸收的元素。
-
举例:
-
原始序列:<9, 10, 14>
-
结果序列:<9, 10, 14>
-
分析:从9往后观察,到最后的元素14都未发现乱序情况,不用处理。
-
原始序列:<9, 14, 10>
-
结果序列:<9, 12, 12>
应用流程:
对于CTR,特征选择的时候,可能会选择很多细粒度的特征,那么直接通过clicks/impressions计算出的点击率会非常不准确。
文献[4]中提出基于下式,提出求解t()的一种近似方法。
The methods by Wang et al. [5] and Meyer [6] find a non-decreasing
mapping function t() that minimizes:

其中,ci表示真实label, pi表示模型输出的预测概率。M是一个表示平滑程度的参数,a和b分别表示输入的预测值的范围,用于平衡拟合程度(goodness-of-fit,第一项)和转换函数t()的平滑度(smoothness,第二项)。
另外,为了维持该模型的识别能力,必须保证该模型是单调递增的。
算法实现流程如下:Algorithm 1: Smooth Isotonic Regression

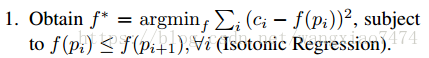
通过Isotonic regression 得到单调且非参数化的函数f(),同时这个函数要使有最小值。
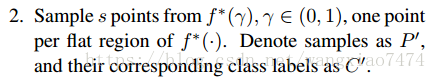
在经过Isotonic Regression函数映射后的数据中,选择s个典型的点,其预测值和对应的label分别记作集合和
。
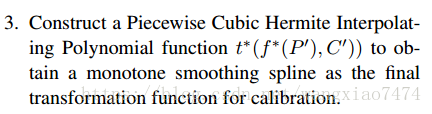
对步骤2中采样的点采用Piecewise Cubic Hermite Interpolating Polynomial (PCHIP)方法进行插值,得到平滑后的单调曲线,并将该曲线作为最终进行校准的映射函数。
理论上讲,该方法比Isotonic regression 更加平滑,比sigmoid regression 更加灵活。
适用情况:
Isotonic Regression is a more powerful calibration method that can correct any monotonic distortion. Unfortunately, this extra power comes at a price. A learning curve analysis shows that Isotonic Regression is more prone to overfitting, and thus performs worse than Platt Scaling, when data is scarce.[1]
Isotonic regression 对模型的输出特征没有要求;
适用于样本量多的情形,样本量少时,使用isotonic regression容易过拟合;
Isotonic Regression通常作为辅助其他方法修复因为数据稀疏性导致的矫正结果不平滑问题;[7]
Microsoft在文献[3]中的CTR预估模型的校准上用到Isotonic Regression。
参考文献:
[1] Alexandru Niculescu-Mizil, et al. Predicting Good Probabilities With Supervised Learning. ICML2005.
[2] https://en.wikipedia.org/wiki/Isotonic_regression
[3] Thore graepel, et al. Web-Scale Bayesian Click-Through Rate Prediction for Sponsored Search Advertising in Microsoft’s Bing Search Engine. ICML2010.
[4] Jiang X, Osl M, Kim J, Ohno-Machado L. Smooth Isotonic Regression: A New Method to Calibrate Predictive Models. AMIA Summits on Translational Science Proceedings. 2011;2011:16-20.
[5] X. Wang and F. Li. Isotonic smoothing spline regression. J Comput Graph Stat, 17(1):21–37, 2008.
[6] M. C. Meyer. Inference using shape-restricted regression splines. Annals of Applied Statistics, 2(3):1013–1033, 2008.
[7] <预测模型结果校准>https://sensirly.github.io/prediction-model-calibration/
保序回归:一种可以使资源利用率最大化的算法
1.数学定义
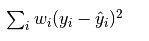
保序回归是回归算法的一种,基本思想是:给定一个有限的实数集合,训练一个模型来最小化下列方程:
并且满足下列约束条件:
2.算法过程说明
从该序列的首元素往后观察,一旦出现乱序现象停止该轮观察,从该乱序元素开始逐个吸收元素组成一个序列,直到该序列所有元素的平均值小于或等于下一个待吸收的元素。
举例:
原始序列:<9, 10, 14>
结果序列:<9, 10, 14>
分析:从9往后观察,到最后的元素14都未发现乱序情况,不用处理。
原始序列:<9, 14, 10>
结果序列:<9, 12, 12>
分析:从9往后观察,观察到14时发生乱序(14>10),停止该轮观察转入吸收元素处理,吸收元素10后子序列为<14, 10>,取该序列所有元素的平均值得12,故用序列<12, 12>替代<14, 10>。吸收10后已经到了最后的元素,处理操作完成。
原始序列:<14, 9, 10, 15>
结果序列:<11, 11, 11, 15>
分析:从14往后观察,观察到9时发生乱序(14>9),停止该轮观察转入吸收元素处理,吸收元素9后子序列为<14,9>。求该序列所有元素的平均值得12.5,由于12.5大于下个待吸收的元素10,所以再吸收10,得序列<14, 9, 10>。求该序列所有元素的平均值得11,由于11小于下个待吸收的元素15,所以停止吸收操作,用序列<11, 11, 11>替代<14, 9, 10>。
3.举例说明下面实验的原理
以某种药物的使用量为例子:
假设药物使用量为数组X=0,1,2,3,4….99,病人对药物的反应量为Y=y1,y2,y3…..y99 ,而由于个体的原因,Y不是一个单调函数(即:存在波动),如果我们按照药物反应排序,对应的X就会成为乱序,失去了研究的意义。而我们的研究的目的是为了观察随着药物使用量的递增,病人的平均反应状况。在这种情况下,使用保序回归,即不改变X的排列顺序,又求的Y的平均值状况。如下图所示:
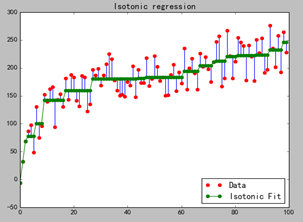
从图中可以看出,最长的绿线x的取值约是30到60,在这个区间内,Y的平均值一样,那么从经济及病人抗药性等因素考虑,使用药量为30个单位是最理想的。
当前IT行业虚拟化比较流行,使用这种方式,找到合适的判断参数,就可以使用此算法使资源得到最大程度的合理利用。
4.实验代码
- import numpy as np
- import matplotlib.pyplot as plt
- from matplotlib.collections import LineCollection
- from sklearn.isotonic import IsotonicRegression
- from sklearn.utils import check_random_state
- n = 100
- ##产生一个0-99的列表
- x = np.arange(n)
- ##实例化一个np.random.RandomState的实例,作用是每次取的随机值相同
- rs = check_random_state(0)
- ##randint(-50, 50):产生-50到50之间的整数
- ##np.log 求以e为低的对数
- y = rs.randint(-50, 50, size=(n,)) + 50. * np.log(1 + np.arange(n))
- ##设置保序回归函数
- ir = IsotonicRegression()
- ##训练数据
- y_ = ir.fit_transform(x, y)
- ##绘图
- segments = [[[i, y[i]], [i, y_[i]]] for i in range(n)]
- ##plt.gca().add_collection(lc),这两步就是画点与平均直线的连线
- lc = LineCollection(segments)
- fig = plt.figure()
- plt.plot(x, y, 'r.', markersize=12)
- plt.plot(x, y_, 'g.-', markersize=12)
- plt.gca().add_collection(lc)
- plt.legend(('Data', 'Isotonic Fit'), loc='lower right')
- plt.title('Isotonic regression')
- plt.show()