大家都知道二叉树,决策树算法就是利用二叉树的结构,利用数据特征对数据集进行分类,直到所有具有相同类型的数据在一个子数据集内。本文的决策树算法参照《机器学习实战第三章,使用ID3算法划分数据集。如何确定用于划分数据的数据特征呢,使用信息论中的信息熵和信息增益作为划分的度量方法。信息熵的概念源自物理热力学,在热力学中用熵表示分子状态的混乱程度,香农在信息论中用熵的来描述信息源的不确定度,可以通过以下公式定义:
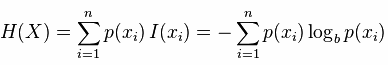
其中p(xi)为每个特征值的概率,I(xi)表示随机变量的信息,信息的定义是:对于一个事件i,它发生的概率是pi,那么它的信息就是对这个概率取对数的相反数:I(xi)=−logbP(xi),其中b为底数,可以取2,10,e.
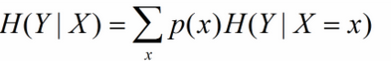
要明白信息增益,我们还要直到条件熵,我们都知道条件概率是给定条件下某个事件发生的概率,条件熵就是给定条件下的条件干率分布的熵对X的数学期望,在机器学习中可以理解为选定某个特征后的熵:
在知道熵、条件熵的概念后,我们就可以得到信息增益:所有分类的熵 - 某个特征值对应的条件熵:
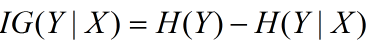
信息增益越大,就代表信息不确定性减少的程度最大,就是说那一个特征的条件熵对熵的影响很大,那么这个特征值就是最好的特征值。
以下是具体的代码实现:
# 决策树算法的代码
import matplotlib.pyplot as plt

decisionNode = dict(boxstyle='sawtooth',fc="0.8")
leafNode = dict(boxstyle='round4',fc="0.8")
arrow_args = dict(arrowstyle="<-")


# 在父子节点间填充文本信息
def plotMidText(cntrPt, parentPt, txtString):
    # 分别计算填充文文本位置的x,y坐标
    xMid = (parentPt[0] - cntrPt[0])/2.0 + cntrPt[0]
    yMid = (parentPt[1] - cntrPt[1])/2.0 + cntrPt[1]
    # createPlot方法的ax1属性为一个plot视图,此处为视图添加文本
    createPlot.ax1.text(xMid,yMid,txtString)

# 计算树的宽和高
def plotTree(myTree, parentPt, nodeTxt):
    # 获取叶节点数
    numleafs = getNumLeafs(myTree)
    depth = getTreeDepth(myTree)
    # 获取树的第一个key(根节点)
    firstStr = list(myTree.keys())[0]
    # 子节点的坐标计算
    # 子节点 X坐标=节点的x偏移量 + (叶节点数 )
    cntrPt = (plotTree.xOff + (1.0 + float(numleafs))/2.0/plotTree.totalW,plotTree.yOff)
    # 填充父子节点键的文本
    plotMidText(cntrPt, parentPt, nodeTxt)
    # 绘制树节点
    plotNode(firstStr,cntrPt,parentPt,decisionNode)
    # 通过第一个key取获取value
    secondDict = myTree[firstStr]
    # 树的Y坐标偏移量
    plotTree.yOff = plotTree.yOff - 1.0/plotTree.totalD
    # 对比value(所有节点名称,通过节点名称获取到对应的dict)
    for key in secondDict.keys():
        if type(secondDict[key]).__name__ == 'dict':
            # 如果遍历到字典,将调用本身绘制子节点
            plotTree(secondDict[key],cntrPt,str(key))
        else: # 已经遍历不到字典,此处已经是最后一个,将其画上
            plotTree.xOff = plotTree.xOff + 1.0/plotTree.totalW
            # 绘制子节点
            plotNode(secondDict[key],(plotTree.xOff, plotTree.yOff),cntrPt, leafNode)
            # 添加节点间的文本信息
            plotMidText((plotTree.xOff, plotTree.yOff),cntrPt, str(key))
    # 确定y的偏移量
    plotTree.yOff = plotTree.yOff + 1.0/plotTree.totalD


# 创建视图
def createPlot(inTree):

    fig = plt.figure(1, facecolor='White')
    fig.clf()

    # 不需要设置x,y的刻度文本
    axprops = dict(xticks= [], yticks=[])
    # 添加子图
    createPlot.ax1 = plt.subplot(111,frameon=False, **axprops)
    # 设置plotTree方法中的变量
    # 总的宽度 = 叶子节点的数量
    plotTree.totalW = float(getNumLeafs(inTree))
    # 总的高度 = 树的层数
    plotTree.totalD = float(getTreeDepth(inTree))
    # 定义plotTree的xOff, yOff属性的初始值
    plotTree.xOff = -0.5/plotTree.totalW; plotTree.yOff = 1.0
    # 调用plotTree方法
    plotTree(inTree, (0.5, 1.0), '')
    plt.show()


# 绘制树节点
def plotNode(nodeTxt, centerPt, parentPt, nodeType):
    createPlot.ax1.annotate(nodeTxt, xy=parentPt,xycoords='axes fraction',
                            xytext=centerPt, textcoords='axes fraction',
                            va="center", ha="center", bbox=nodeType, arrowprops=arrow_args)


# def create_plot():
#     fig = plt.figure(1,facecolor='white')
#     fig.clf()
#     create_plot.ax1 = plt.subplot(111, frameon=False)
#     plotNode('决策节点',(0.5, 0.1), (0.1, 0.5), decisionNode)
#     plotNode('叶节点',(0.8, 0.1),(0.3, 0.8), leafNode)
#     plt.show()


# 获取叶节点数
def getNumLeafs(myTree):
    # 初始化叶节点的计数
    numLeafs = 0
    # 从myTree的所有节点获取第一个节点(根节点)
    firstStr = list(myTree.keys())[0]
    # 通过跟节点的key取出根key对应的value
    secondDict = myTree[firstStr]
    # 遍历根key的value(value包含根key包含的余下所有的子节点)
    # 上一级的value包含下一级的key,因此通过递归,可以不断取到下一层的value
    for key in secondDict.keys():
        # 只要获取到的value的是字典的类型,就进行递归,接着往下取叶节点
        if type(secondDict[key]).__name__ == 'dict':
            # 每次递归调用该函数都会获取到该节点下的所有叶节点,并进行计数
            numLeafs += getNumLeafs(secondDict[key])
        # 如果获取的vlaue不再是字典,说明已经是最后一个子节点,进行一次加1操作
        else: numLeafs += 1
    return numLeafs


# 获取树的层数

def getTreeDepth(myTree):
    # 树的层数与获取叶节点的步骤相似,区别在于
    # 叶节点数每遍历一次,如果遍历到叶子节点,那么将计数加一,累计叶子节点的个数;
    # 树层数的计数在递归的过程中,如果遍历到叶子节点,就会将计数值置为1,只保留max的计数。
    # 将这一层的深度记为1


    # 初始化一个记录最大深度的变量
    maxDepth = 0
    firstStr = list(myTree.keys())[0]
    secondDict = myTree[firstStr]
    for key in secondDict.keys():
        if type(secondDict[key]).__name__ == 'dict':
        # 每次递归都进行依次+1的计数操作
            thisDepth = 1 + getTreeDepth(secondDict[key])
        # 如果没有遍历到dict,只有只有一层
        else: thisDepth = 1
        # 每一个key对用的子节点串(每一条路径)都会有一个最大值,记录其中最大的那个
        if thisDepth > maxDepth: maxDepth = thisDepth
    return maxDepth


# 输出预先存储的树信息
def retriveTree(i):
    listOfTrees = [{'no surfacing': {0: 'no', 1:{'flippers':{0:'no',1:'yes'}}}},
                   {'no surfacing': {0: 'no', 1:{'flippers':{0: {'head':{0: 'no', 1:'yes'}}, 1: 'no'}}}}]

    return listOfTrees[i]
# 绘制决策树的代码
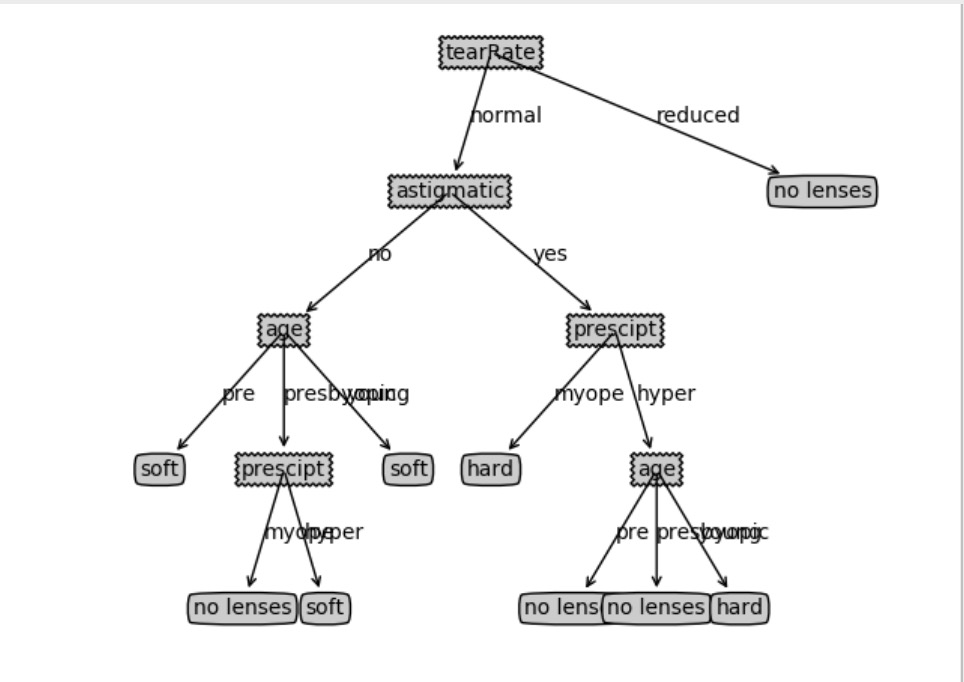
import matplotlib.pyplot as plt
from cha03_trees import trees

decisionNode = dict(boxstyle='sawtooth',fc="0.8")
leafNode = dict(boxstyle='round4',fc="0.8")
arrow_args = dict(arrowstyle="<-")


# 在父子节点间填充文本信息
def plotMidText(cntrPt, parentPt, txtString):
    # 分别计算填充文文本位置的x,y坐标
    xMid = (parentPt[0] - cntrPt[0])/2.0 + cntrPt[0]
    yMid = (parentPt[1] - cntrPt[1])/2.0 + cntrPt[1]
    # createPlot方法的ax1属性为一个plot视图,此处为视图添加文本
    createPlot.ax1.text(xMid,yMid,txtString)

# 计算树的宽和高
def plotTree(myTree, parentPt, nodeTxt):
    # 获取叶节点数
    numleafs = getNumLeafs(myTree)
    depth = getTreeDepth(myTree)
    # 获取树的第一个key(根节点)
    firstStr = list(myTree.keys())[0]
    # 子节点的坐标计算
    # 子节点 X坐标=节点的x偏移量 + (叶节点数 )
    cntrPt = (plotTree.xOff + (1.0 + float(numleafs))/2.0/plotTree.totalW,plotTree.yOff)
    # 填充父子节点键的文本
    plotMidText(cntrPt, parentPt, nodeTxt)
    # 绘制树节点
    plotNode(firstStr,cntrPt,parentPt,decisionNode)
    # 通过第一个key取获取value
    secondDict = myTree[firstStr]
    # 树的Y坐标偏移量
    plotTree.yOff = plotTree.yOff - 1.0/plotTree.totalD
    # 对比value(所有节点名称,通过节点名称获取到对应的dict)
    for key in secondDict.keys():
        if type(secondDict[key]).__name__ == 'dict':
            # 如果遍历到字典,将调用本身绘制子节点
            plotTree(secondDict[key],cntrPt,str(key))
        else: # 已经遍历不到字典,此处已经是最后一个,将其画上
            plotTree.xOff = plotTree.xOff + 1.0/plotTree.totalW
            # 绘制子节点
            plotNode(secondDict[key],(plotTree.xOff, plotTree.yOff),cntrPt, leafNode)
            # 添加节点间的文本信息
            plotMidText((plotTree.xOff, plotTree.yOff),cntrPt, str(key))
    # 确定y的偏移量
    plotTree.yOff = plotTree.yOff + 1.0/plotTree.totalD


# 创建视图
def createPlot(inTree):

    fig = plt.figure(1, facecolor='White')
    fig.clf()

    # 不需要设置x,y的刻度文本
    axprops = dict(xticks= [], yticks=[])
    # 添加子图
    createPlot.ax1 = plt.subplot(111,frameon=False, **axprops)
    # 设置plotTree方法中的变量
    # 总的宽度 = 叶子节点的数量
    plotTree.totalW = float(getNumLeafs(inTree))
    # 总的高度 = 树的层数
    plotTree.totalD = float(getTreeDepth(inTree))
    # 定义plotTree的xOff, yOff属性的初始值
    plotTree.xOff = -0.5/plotTree.totalW; plotTree.yOff = 1.0
    # 调用plotTree方法
    plotTree(inTree, (0.5, 1.0), '')
    plt.show()


# 绘制树节点
def plotNode(nodeTxt, centerPt, parentPt, nodeType):
    createPlot.ax1.annotate(nodeTxt, xy=parentPt,xycoords='axes fraction',
                            xytext=centerPt, textcoords='axes fraction',
                            va="center", ha="center", bbox=nodeType, arrowprops=arrow_args)


# def create_plot():
#     fig = plt.figure(1,facecolor='white')
#     fig.clf()
#     create_plot.ax1 = plt.subplot(111, frameon=False)
#     plotNode('决策节点',(0.5, 0.1), (0.1, 0.5), decisionNode)
#     plotNode('叶节点',(0.8, 0.1),(0.3, 0.8), leafNode)
#     plt.show()


# 获取叶节点数
def getNumLeafs(myTree):
    # 初始化叶节点的计数
    numLeafs = 0
    # 从myTree的所有节点获取第一个节点(根节点)
    firstStr = list(myTree.keys())[0]
    # 通过跟节点的key取出根key对应的value
    secondDict = myTree[firstStr]
    # 遍历根key的value(value包含根key包含的余下所有的子节点)
    # 上一级的value包含下一级的key,因此通过递归,可以不断取到下一层的value
    for key in secondDict.keys():
        # 只要获取到的value的是字典的类型,就进行递归,接着往下取叶节点
        if type(secondDict[key]).__name__ == 'dict':
            # 每次递归调用该函数都会获取到该节点下的所有叶节点,并进行计数
            numLeafs += getNumLeafs(secondDict[key])
        # 如果获取的vlaue不再是字典,说明已经是最后一个子节点,进行一次加1操作
        else: numLeafs += 1
    return numLeafs


# 获取树的层数

def getTreeDepth(myTree):
    # 树的层数与获取叶节点的步骤相似,区别在于
    # 叶节点数每遍历一次,如果遍历到叶子节点,那么将计数加一,累计叶子节点的个数;
    # 树层数的计数在递归的过程中,如果遍历到叶子节点,就会将计数值置为1,只保留max的计数。
    # 将这一层的深度记为1


    # 初始化一个记录最大深度的变量
    maxDepth = 0
    firstStr = list(myTree.keys())[0]
    secondDict = myTree[firstStr]
    for key in secondDict.keys():
        if type(secondDict[key]).__name__ == 'dict':
        # 每次递归都进行依次+1的计数操作
            thisDepth = 1 + getTreeDepth(secondDict[key])
        # 如果没有遍历到dict,只有只有一层
        else: thisDepth = 1
        # 每一个key对用的子节点串(每一条路径)都会有一个最大值,记录其中最大的那个
        if thisDepth > maxDepth: maxDepth = thisDepth
    return maxDepth


# 输出预先存储的树信息
def retriveTree(i):
    listOfTrees = [{'no surfacing': {0: 'no', 1:{'flippers':{0:'no',1:'yes'}}}},
                   {'no surfacing': {0: 'no', 1:{'flippers':{0: {'head':{0: 'no', 1:'yes'}}, 1: 'no'}}}}]

    return listOfTrees[i]


if __name__ == '__main__':
    # myTree = retriveTree(0)
    # createPlot(myTree)
    fr = open("../cha03_trees/lenses.txt")
    lenses = [inst.strip().split('	') for inst in fr.readlines()]
    lensLabels = ['age', 'prescipt','astigmatic','tearRate']
    lensesTree = trees.createTree(lenses, lensLabels)
    createPlot(lensesTree)
运行结果:
代码地址:https://github.com/ZhaoJiangJie/MLInAction/tree/master/cha03_trees
参考:1.《机器学习实战》peter Harrington 著
2.https://www.cnblogs.com/fantasy01/p/4581803.html
3.https://www.zhihu.com/question/22104055
4.http://blog.csdn.net/aws3217150/article/details/49906389