Windows®Sysinternals Administrator’s Reference
66:一共三点 2012-3-21 17:10:37
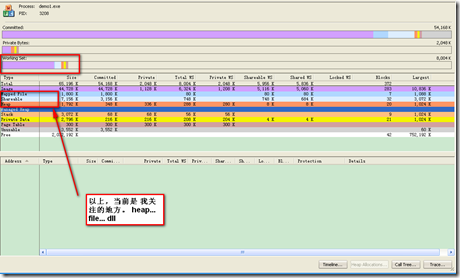
所有 内存区域的类型。
关于堆的 观察。
还有trap.. snap的使用
//end
66当前的问题:不是 程序退出时的泄漏,
这些通过purify 可以搞定,而是 运行中 的 内存消耗率。
创意
66:这里说到可以通过这里看到 申请最多空间的函数调用的谁?
66:这里统计 堆分配 函数调用的次数很有意思。
除了 第一次系统的学习到了 快照之间对比的方法。这里的 观看系统的分配也是这一次的亮点
选中了 2个时间点,在主界面皆可以看到 以前的,和现在的了。
这一点,必须注意You must manually initiate each snapshot by pressing F5.
终于找到了trace 的接口
待办事项
66:以上共享方式 不知晓
程序运行中,可以把工作集合 释放?? 关注。。
浅 ??
突出显示
上面列举监视堆分配的类型。 When alloc..
Process and Diagnostic Utilities
Process Explorer and Process Monitor,
discussed in Chapters 3 and 4, respectively, are the primary utilities for analyzing the runtime behavior
and dynamic state of processes and of the system as a whole.
This chapter describes six additional Sysinternals utilities for viewing details of process state:
■ VMMap is a GUI utility that displays details of a process’ virtual and physical memory usage.
■ ProcDump is a console utility that can generate a memory dump for a process when it meets specifiable criteria, such as exhibiting a CPU spike or having an unresponsive window.
■ DebugView is a GUI utility that lets you monitor user-mode and kernel-mode debug output generated from either the local computer or a remote computer.
| 66 | Linux dmesg logcat? |
■ LiveKd lets you run a standard kernel debugger on a snapshot of the running local system without having to reboot into debug mode.
■ ListDLLs is a console utility that displays information about DLLs loaded on the system.
■ Handle is a console utility that displays information about object handles held by processes on the system.
VMMap
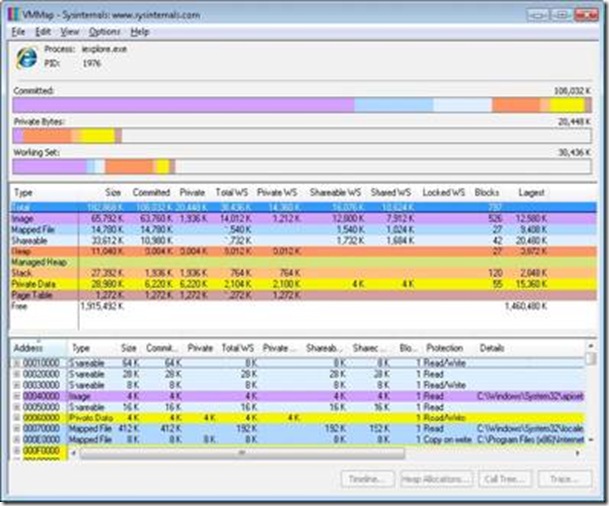
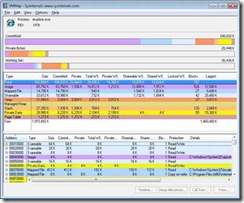
VMMap (shown in Figure 7-1) is a process virtual and physical memory analysis utility. It shows graphical and tabular summaries of the different types of memory allocated by a process, as well as detailed maps of the specific virtual memory allocations, showing characteristics such as backing files and types of protection. VMMap also shows summary and detailed information about the amount of physical memory (working set) assigned by the operating system for the different virtual memory blocks.
VMMap can capture multiple snapshots of the process’ memory allocation state, graphically display allocations over time, and show exactly what changed between any two points in time. Combined with
VMMap’s filtering and refresh options, this allows you to identify the sources of process memory usage and the memory cost of application features.
VMMap can also instrument a process to track its individual memory allocations and show the code paths and call stacks where those allocations are made. With full symbolic information, VMMap can display the line of source code responsible for any memory allocation.
| 66 | 看下面的按钮 不就知道了哈。。。 |
FIGURE 7-1 VMMap main window.
Besides flexible views for analyzing live processes, VMMap supports the export of data in multiple formats, including a native format that preserves detailed information so that you can load it back into VMMap at a later time. It also includes command-line options that enable scripting scenarios.
VMMap is the ideal tool for developers who want to understand and optimize their application’s memory resource usage. (To see how Microsoft Windows allocates physical memory as a systemwide resource, see RAMMap, which is described in Chapter 14, “System Information Utilities.”) VMMap runs on x86 and x64 versions of Windows XP and newer.
Starting VMMap and Choosing a Process
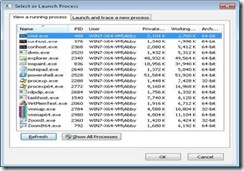
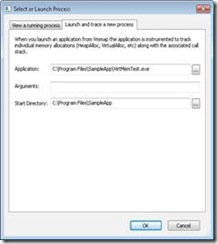
The first thing you must do when starting VMMap is to pick a process to analyze. If you don’t specify a process or an input file on the VMMap command line (described later in this chapter), VMMap displays its Select or Launch Process dialog box. Its View A Running Process tab lets you pick a process that is already running, and the “Launch And Trace A New Process tab lets you start a new, instrumented process and track its memory allocations. You can display the Select or Launch Process dialog box at a later time by pressing Ctrl+P.
View a Running Process
Select a process from the View A Running Process tab (shown in Figure 7-2), and click OK. To quickly find a process by process ID (PID) or by memory usage, click on any column header to sort the rows by that column. The columns include User, Private Bytes, Working Set, and Architecture (that is, whether the process is 32-bit or 64-bit). Click Refresh to update the list.
FIGURE 7-2 VMMap Select or Launch Process dialog box lists running processes.
The View A Running Process tab lists only processes that VMMap can open. If VMMap is not running with administrative permissions (including the Debug privilege), the list includes only processes running as the same user as VMMap and at the same integrity level or a lower one. On Windows Vista and newer, you can restart VMMap with elevated rights by clicking the Show All Processes button in the dialog box, or by choosing File | Run As Administrator.
On x64 editions of Windows, VMMap can analyze 32-bit and 64-bit processes. VMMap launches a 32-bit version of itself to analyze 32-bit processes and a 64-bit version to analyze 64-bit processes. (See “Single Executable Image” in Chapter 1, “Getting Started with the Sysinternals Utilities,” for more information.) With the –64 command-line option, described later in this chapter, the 64-bit version is used to analyze all processes.
Launch and Trace a New Process
| 66 | 终于找到了trace 的接口 |
When you launch an application from VMMap, the application is instrumented to track all individual memory allocations along with the associated call stack. Enter the path to the application and optionally any command-line arguments and the start directory as shown in Figure 7-3, and then click OK.
FIGURE 7-3 Launch and trace a new process.
VMMap injects a DLL into the target process at startup and intercepts its virtual memory API calls. Along with the allocation type, size, and memory protection, VMMap captures the call stack at the point when the allocation is made. VMMap aggregates this information in various ways, which are described in the “Viewing Allocations from Instrumented Processes” section later in this chapter. (See “Call Stacks and Symbols” in Chapter 2, “Windows Core Components,” for more information.)
On x64 editions of Windows, VMMap can instrument and trace x86 and x64 programs, launching a 32-bit or 64-bit version of itself accordingly. However, on x64 Windows VMMap cannot instrument and trace .NET programs built for “Any CPU.. It can instrument those programs on 32-bit versions of Windows, and you can analyze an “Any CPU” program on x64 without instrumentation by picking it from the View A Running Process tab of the Select or Launch Process dialog box.
The VMMap window //相当于overview
After you select or launch a process, VMMap analyzes the process,
displaying graphical representations of virtual and physical memory,
and tabular Summary and Details Views. Memory types are color coded
in each of these components, with the Summary View also serving as a color key.
| 66 | 下面是分层次阅读 |
| The first bar graph in the VMMap window (shown in Figure 7-1) is the Committed summary. Its differently-colored areas show the relative proportions of the different types of committed memory within the process’ address space. | It also serves as the basis against which the other two graphs are scaled. The total figure shown above the right edge of the graph is not all allocated memory, but the process’ “accessible” memory. | Regions that have only been reserved cannot yet be accessed and are not included in this graph. In other words, the memory included here is backed by RAM, a paging file, or a mapped file. |
|
|
| 66:不仅仅是 驻留到银盘上的,比较工作集合,品读 |
| The second bar graph in the VMMap window is the Private Bytes summary. This is process memory not shareable with other processes and that’s backed by physical RAM or by a paging file. | It includes the stack, heaps, raw virtual memory, page tables, and read/write portions of image and file mappings. The label above the right side of the graph reports the total size of the process’ private memory. | The colored areas in the bar graph show the proportions of the various types of memory allocations contributing to the private byte usage. The extent of the colored areas toward the graph’s right edge indicates its proportion to in-use virtual memory |
| The third bar graph shows the working set for the process. | The working set is the process’ virtual memory that is resident in physical RAM. | Like the Private Bytes graph, the colored areas show the relative proportions of different types of allocations in RAM, and their extent toward the right indicates the proportion of the process’ committed virtual memory that is resident in RAM. |
| Note that these graphs show only the relative proportions of the different allocation types. They are not layout maps that show where in memory they are allocated. The Address Space Fragmentation dialog box, described later in this chapter, provides such a map for 32-bit processes. | 浅 |
| Below the three graphs, the Summary View table lists the different types of memory allocations (described in the “Memory Types” section in this chapter), | the total amount of each type of allocation, how much is committed, and how much is in physical RAM. | Select a memory type in Summary View to filter what is shown in the Details View window. You can sort the Summary View table by the values in any column by clicking the corresponding column header. Clicking a column header again reverses the sort order for that column. The order of the colored areas in the VMMap bar graphs follows the sort order of the Summary View table. You can also change the column order for this table by dragging a column header to a new position, and resize column widths by dragging the borders between the column headers. |
Below Summary View, Details View displays information
about each memory region of the process’ user-mode virtual address space.
To show only one allocation type in Details View, select that type in the Summary View.
To view all memory allocations, select the Total row in the Summary View.
As with the Summary View, the columns in Details View allow sorting, resizing and reordering.
| Allocations shown in Details View can expand to show sub-blocks within the original allocation. This can occur, | for example, when a large block of memory is reserved, and then parts of it are committed.
It also occurs when the image loader or an application creates a file mapping and then creates multiple mapped views of that file mapping;
for example, to set protection differently on the different regions of the file mapping. | You can expand or collapse individual groups of sub-allocations by clicking the plus (+) and minus (–) icons in Details View. You can also expand or collapse all of them by choosing Expand All or Collapse All from the Options menu.
The top row of such a group shows the sums of the individual components within it.
When a different sort order is selected for Details View, sub-blocks remain with their top-level rows and are sorted within that group. |
If VMMap’s default font is not to your liking, choose Options | Font to select a different font for Summary View, Details View, and some of VMMap’s dialog boxes.
Memory Types //重要
VMMap categorizes memory allocations into one of several types:
| ■ Image
The memory represents an executable file, such as an EXE or DLL, that has been loaded into a process by the image loader.
Note that Image memory does not include executable files loaded as data files—
these are included in the Mapped File memory type. | Executable code regions are typically read/execute-only and shareable.
Data regions, such as initialized data, are typically read/write or copy-on-write.
When copy-on-write pages are modified, additional private memory is created in the process and is marked as read/write.
This private memory is backed by RAM or a paging file and not by the image file. The Details column in Details View shows the file’s path or section name. |
■ Mapped File The memory is shareable and represents a file on disk.
Mapped files are often resource DLLs and typically contain application data. The Details column shows the file's path.
| ■ Shareable Shareable memory is memory that can be shared with other processes and is backed by RAM or by the paging file (if present).
| Shareable memory typically contains data shared between processes through DLL shared sections or through pagefile-backed, file-mapping objects (also known as pagefile-backed sections).
|
|
|
| 66:以上共享方式 不知晓 |
|
■ Heap A heap represents private memory allocated and managed by the user-mode heap manager
and typically contains application data. Application memory allocations that use Heap memory
include the C runtime malloc library, the C++ new operator, the Windows Heap APIs, and the legacy GlobalAlloc and LocalAlloc APIs.
| 66 | 总结的不错 |
■ Managed Heap Managed Heap represents private memory that is allocated and managed
by the .NET runtime and typically contains application data.
■ Stack Stack memory is allocated to each thread in a process to store function parameters, local variables,
and invocation records. Typically, a fixed amount of Stack memory is allocated and reserved when a thread is created,
but only a relatively small amount is committed. The amount of memory committed within that allocation will grow as needed,
but it will not shrink. Stack memory is freed when its thread exits.
| ■ Private Data Private Data memory is memory that is allocated by VirtualAlloc and that is not further handled by the Heap Manager or the .NET runtime, or assigned to the Stack category. | Private Data memory typically contains application data, as well as the Process and Thread Environment Blocks. Private Data memory cannot be shared with other processes. |
|
| 66:记住 ped. Teb 环境块是 private ,其他浅 |
■ Page Table Page Table memory is private kernel-mode memory associated with the process’ page tables.
Note that Page Table memory is never displayed in VMMap’s Details View, which shows only user-mode memory.
■ Free Free memory regions are spaces in the process’ virtual address space that are not allocated.
To include free memory regions in Details View when inspecting a process’ total memory map, choose Options | Show Free Regions.
| 小结66 | 除了传统的 text data, bss (share)...这里还有 private data...工程需要,看内存泄露,主要是heap |
Memory Information
Summary View and Details View show the following information for allocation types and individual allocations. To reduce noise in the output, VMMap does not show entries that have a value of 0.
■ Size The total size of the allocated type or region. This includes areas that have been reserved but not committed.
■ Committed The amount of the allocation that is committed—that is, backed by RAM, a paging file, or a mapped file.
■ Private The amount of the allocation that is private to the process.
■ Total WS The total amount of working set (physical memory) assigned to the type or region.
■ Private WS The amount of working set assigned to the type or region that cannot be shared with other processes.
■ Shareable WS The amount of working set assigned to the type or region that can be shared with other processes.
■ Shared WS The amount of Shareable WS that is currently shared with other processes.
■ Locked WS The amount of memory that has been guaranteed to remain in physical memory and not incur a page fault when accessed.
■ Blocks The number of individually allocated memory regions.
■ Largest In Summary View, the size of the largest contiguous memory block for that allocation type.
■ Address In Details View, the base address of the memory region in the process’ virtual address space.
■ Protection In Details View, identifies the types of operations that can be performed on the memory. In the case of top-level allocations that show expandable sub-blocks, Protection identifies a summary of the types of protection in the sub-blocks. An access violation occurs on an attempt to execute code from a region not marked Execute (if DEP is enabled), to write to a region not marked Write or Copy-on-Write, or to access memory that is marked as no-access or is only reserved but not yet committed.
■ Details In Details View, additional information about the memory region, such as the path to its backing file, Heap ID (for Heap memory), Thread ID (for Stack memory), or .NET AppDomain and Garbage Collection generations.
Timeline and Snapshots
VMMap retains a history of snapshots of the target process’ memory allocation state. You can load any of these snapshots into the VMMap main view and compare any two snapshots to see what changed.
When tracing an instrumented process, VMMap captures snapshots automatically. You can set the automatic capture interval to 1, 2, 5, or 10 seconds from the Options | Trace Snapshot Interval submenu. You can pause and resume automatic snapshots by pressing Ctrl+Space, and manually capture a new snapshot at any time by pressing F5.
When you analyze a running process instead of launching an instrumented one, VMMap does not automatically capture snapshots. You must manually initiate each snapshot by pressing F5.
| 66 | 这一点,必须注意You must manually initiate each snapshot by pressing F5. |
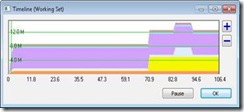
Click the Timeline button on the VMMap main view to display the Timeline dialog box (shown in Figure 7-4), which renders a graphical representation of the history of allocations in the process’ working set. The Timeline lets you load a previous snapshot into the VMMap main view and compare any two snapshots. The graph’s horizontal axis represents the number of seconds since the initial snapshot, and its vertical access to the process’ working set. The colors in the graph correspond to the colors used to represent memory types in the VMMap main window.
FIGURE 7-4 VMMap Timeline dialog box.
When automatic capture is enabled for an instrumented trace, the Timeline dialog box automatically updates its content. You can click the Pause button to suspend automatic snapshot capture; click it again to resume automatic captures. When viewing a process without instrumented tracing, the Timeline dialog box must be closed and reopened to update its content.
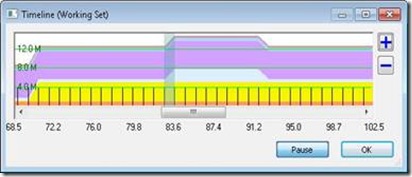
Click on any point within the timeline to load the corresponding snapshot into the VMMap main view. To compare any two snapshots, click on a point near one of the snapshots and then drag the mouse to the other point. While you have the mouse button down, the time-line displays vertical lines indicating when snapshots were captured and shades the area between the two selected points, as shown in Figure 7-5. To increase the granularity of the timeline to make it easier to select snapshots, click the plus (+) and minus (–) zoom buttons and move the horizontal scroll.
| 66 | 这里说的 是 选中 两个选区吗? |
FIGURE 7-5 VMMap Timeline dialog box while dragging between two snapshots.
| When you compare two snapshots, the VMMap main view graphs and tables show the differences between the two snapshots. All displayed numbers show the positive or negative changes since the previous snapshot. | Address ranges in Details View that are in the new snapshot but not in the previous one are highlighted in green; address ranges that were only in the previous screen shot are highlighted in red. | You might need to expand sub-allocations to view these. Rows in Details View that retain their normal color indicate a change in the amount of assigned working set. To view changes only for a specific allocation type, select that type in Summary View. |
| 66 | 选中了 2个时间点,在主界面皆可以看到 以前的,和现在的了。 |
| If you choose Empty Working Set from the View menu, VMMap first releases all physical memory assigned to the process and then captures a new snapshot. | This feature is useful for measuring the memory cost of an application feature: | empty the working set, exercise the feature, and then refresh the display to look at how much physical memory the application referenced. |
| 66 | 程序运行中,可以把工作集合 释放?? 关注。。 |
To switch from comparison view to single-snapshot view, open the Timeline dialog box and click on any snapshot.
Viewing Text Within Memory Regions
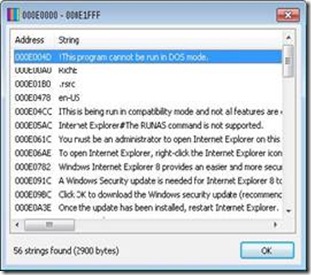
In some cases, the purpose of a memory region can be revealed by the string data stored within it. To view ASCII or Unicode strings of three or more characters in length, select a region in Details View and then choose View | Strings. VMMap displays a dialog box showing the virtual address range and the strings found within it, as shown in Figure 7-6. If the selected region has sub-blocks, the entire region is searched.
String data is not captured as part of a snapshot. The feature works only with a live process, and not with a saved VMMap (.mmp) file loaded from disk. Further, the strings are read directly from process memory when you invoke the Strings feature. That memory might have changed since the last snapshot was captured.
| 66 | 个人感觉就是 搜索文本区的事情而已 |
FIGURE 7-6 The VMMap Strings dialog box.
Finding and Copying Text
To search for specific text within Details View, press Ctrl+F. The Find feature selects the next visible row in Details View that contains the text you specify in any column. Note that it will not search for text in unexpanded sub-blocks. To repeat the previous search, press F3.
VMMap offers two ways to copy text from the VMMap display to the clipboard:
■ Ctrl+A copies all text from the VMMap display, including the process name and ID, and all text in Summary View and Details View, retaining the sort order. All sub-allocation data is copied even if it is not expanded in the view. If a specific allocation type is selected in Summary View, only that allocation type will be copied from Details View.
■ Ctrl+C copies all text from the Summary View table if Summary View has focus. If Details View has focus, Ctrl+C copies the address field from the selected row, which can then be pasted into a debugger.
Viewing Allocations from Instrumented Processes
When VMMap starts an instrumented process, it intercepts the program’s
calls to virtual memory APIs and captures information about the calls.
The captured information includes the following:
■ The function name, which indicates the type of allocation. For example, VirtualAlloc and VirtualAllocEx allocate private memory;
RtlAllocateHeap allocates heap memory.
■ The operation, such as Reserve, Commit, Protect (change protection), and Free.
■ The memory protection type, such as Execute/Read and Read/Write.
■ The requested size, in bytes.
■ The virtual memory address at which the allocated block was created.
■ The call stack at the point when the API was invoked.
| 66 | 上面列举监视的类型。 When alloc.. |
The call stack identifies the code path within the program that resulted in the allocation request.
VMMap assigns a Call Site ID number to each unique call stack that is captured.
The first call stack is assigned ID 1, the second unique stack is assigned ID 2, and so forth.
If the same code path is executed multiple times, each instance will have the same call stack,
and the data from those allocations are grouped together under a single Call Site ID.
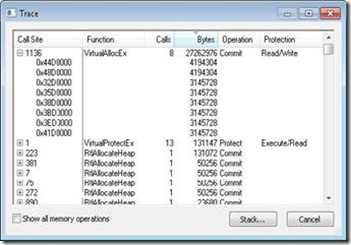
| Refresh the VMMap main view, and then click the Trace button. The Trace dialog box (shown in Figure 7-7) lists all captured memory allocations grouped by Call Site ID. The Function column identifies the API that was called; | the Calls column indicates how many times that code path was invoked; the Bytes column lists the total amount of memory allocated through that site. The values in the Operation and Protection columns are the values that were passed in the first time the call site was invoked. |
|
| 66:这里统计 堆分配 函数调用的次数很有意思。 |
FIGURE 7-7 VMMap Trace dialog box.
| 66 | 除了 第一次系统的学习到了 快照之间对比的方法。这里的 观看系统的分配也是这一次的亮点 |
|
Click the plus sign to expand the call site and show the virtual memory addresses at which the requested memory was provided. The Bytes column shows the size of each allocation.
| Note that when memory is freed, a subsequent allocation request through the same call site might be satisfied at the same address. When this happens, VMMap does not display a separate entry. The Bytes column reports the size only of the first allocation granted at that address. However, the sum shown for the Call Site is accurate. |
|
| 66:这里说到同一地址可能用到两次,vmmap 只统计第一次 |
By default, the Trace dialog box shows only those operations for which “Bytes” is more than
0. Select the “Show all memory operations” check box to display operations that report no bytes.
These include operations such as RtlCreateHeap, RtlFreeHeap, and VirtualFree
(when releasing an entire allocation block).
| 66 | 上面说到vmmap 也会统计 没有空间申请到的情形。 |
In Figure 7-7, the call site assigned the ID 1136 was invoked eight times to allocate 26 MB of private memory.
That node is expanded and shows the virtual memory addresses and the requested sizes.
Because all of these requests went through a single code path,
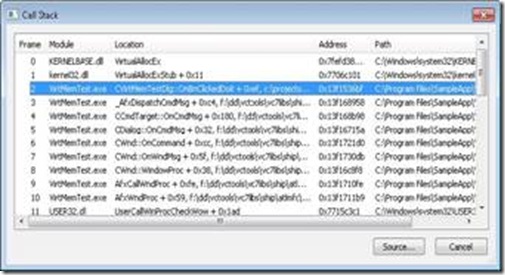
you can select any of them or the top node and click the Stack button to see that site’s call stack, shown in Figure 7-8.
If full symbolic information and source files are available,
select a frame in the call stack and click the
Source button to view the source file in the VMMap source file viewer with the indicated line of source selected.
FIGURE 7-8 Call stack for a call site accessed from the Trace dialog box.
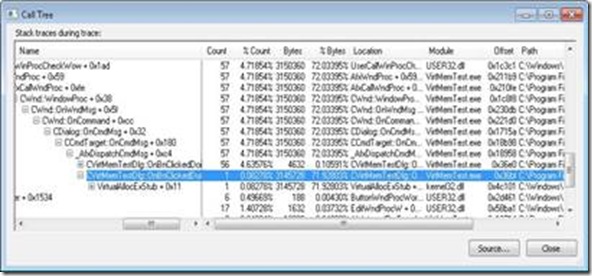
| Click the Call Tree button in the VMMap main window for another way to visualize where your program allocates memory. The Call Tree dialog box (shown in Figure 7-9) identifies the commonalities and divergences in all the collected call stacks and renders them as an expandable tree. | The topmost nodes represent the outermost functions in the call stacks. Their child nodes represent functions that they called, and their child nodes represent the various functions they called on the way to a memory operation. | Across each row, the Count and % Count columns indicate how many times in the collected set of call stacks that code path was traversed; the Bytes and % Bytes columns indicate how much memory was allocated through that path. You can use this to quickly drill down to the places where the most allocations were invoked or the most memory was allocated. |
|
|
| 66:这里说到可以通过这里看到 申请最多空间的函数调用的谁? |
FIGURE 7-9 The VMMap Call Tree dialog box.
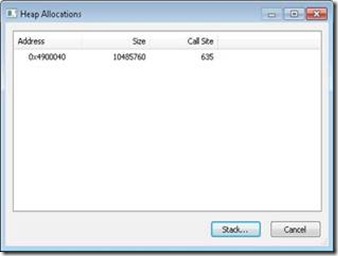
Finally, you can view the call stack for a specific heap allocation by selecting it
in Details View and clicking the Heap Allocations button to display the Heap Allocations dialog box.
(See Figure 7-10). Select the item in the dialog box, and click Stack to display the call stack that resulted in that allocation.
FIGURE 7-10 The Heap Allocations dialog box.
Address Space Fragmentation
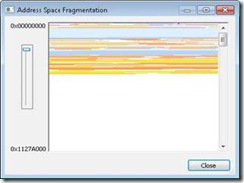
Poor or unlucky memory management can result in a situation where there is plenty of free memory, but no individual free blocks large enough to satisfy a particular request. For 32-bit processes, the Address Space Fragmentation dialog box (shown in Figure 7-11) shows the layout of the different allocation types within the process’ address space. This can help identify whether fragmentation is a problem and locate the problematic allocations.
FIGURE 7-11 Address Space Fragmentation (32-bit processes only).
| 66 | 这个工具 在物理视图上,挺宏观的啊。个人感觉不实用 |
| When analyzing a 32-bit process, choose View | Fragmentation View to display Address Space Fragmentation. The graph indicates allocation types using the same colors as the VMMap main view, with lower virtual addresses at the top of the window. | The addresses at the upper and lower left of the graph indicate the address range currently shown. If the entire address range cannot fit in the window, you move the vertical scroll bar to view other parts of the address range. The slider to the left of the graph changes the granularity of the graph. Moving the slider down increases the size of the blocks representing memory allocations in the graph. If you click on a region in the graph, the dialog box shows its address, size, and allocation type just below the graph, and it selects the corresponding allocation in Details View of the VMMap main view. |
| 66 | pass |
Saving and Loading Snapshot Results
The Save and Save As menu items in the File menu include several file formats to save output from a VMMap snapshot. The Save As Type drop-down list in the file-save dialog box includes the following:
■ .MMP This is the native VMMap file format. Use this format if you want to load the output back into the VMMap display on the same computer or a different computer. This format saves data from all snapshots, enabling you to view differences from the Timeline dialog box when you load the file back into VMMap.
■ .CSV This option saves data from the most recent snapshot as comma-separated values, which is ideal for generating output that you can easily import into Microsoft Excel. If a specific allocation type is selected in Summary View, details are saved only for that memory type.
■ .TXT This option saves data as formatted text, which is ideal for sharing the text results in a readable form using a monospace font. Like the .CSV format, if a specific allocation type is selected, details are saved only for that type.
To load a saved .MMP file into VMMap, press Ctrl+O, or pass the file name to VMMap on the command line with the –o option. Also, when a user runs VMMap, VMMap associates the .mmp file extension with the path to that instance of VMMap and the –o option so that users can open a saved .mmp file by double-clicking it in Windows Explorer.
| 66 | pass |
VMMap Command-Line Options
VMMap supports the following command-line options:
vmmap [-64] [-p {PID | processname} [outputfile]] [-o inputfile]
–64
On x64 editions of Windows, VMMap will run a 32-bit version of itself when a 32-bit process is selected, and a 64-bit version when a 64-bit process is selected. With the –64 option, the 64-bit version of VMMap is used to analyze all processes. For 32-bit processes, the 32-bit version of VMMap more accurately categorizes allocation types. The only advantages of the 64-bit version are that it can identify the thread ID associated with 64-bit stacks and more accurately report System memory statistics.
–p {PID | processname} [outputfile]
Use this format to analyze the process specified by the PID or process name. If you specify a name, VMMap will match it against the first process that has a name that begins with the specified text.
If you specify an output file, VMMap will scan the target process, output results to the named file, and then terminate. If you don’t include an extension, VMMap will add .MMP and save in its native format. Add a .CSV extension to the output file name to save as comma-separated values. Any other file extension will save the output using the .TXT format.
–o inputfile
When you use this command, VMMaps open the specified .MMP input file on startup.
Restoring VMMap defaults
VMMap stores all its configuration settings in the registry in “HKEY_CURRENT_USER\ Software\Sysinternals\VMMap.” The simplest way to restore all VMMap configuration settings to their defaults is to close VMMap, delete the registry key, and then start VMMap again.
