step1:添加插件echart;
npm install echarts --save
package.json文件中会在dependencies中添加echarts,如下图:

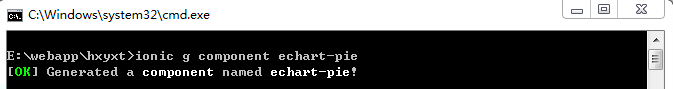
step2:运行cmd,创建echart-pie组件;
ionic g component echart-pie
如下图:
生成对应文件:
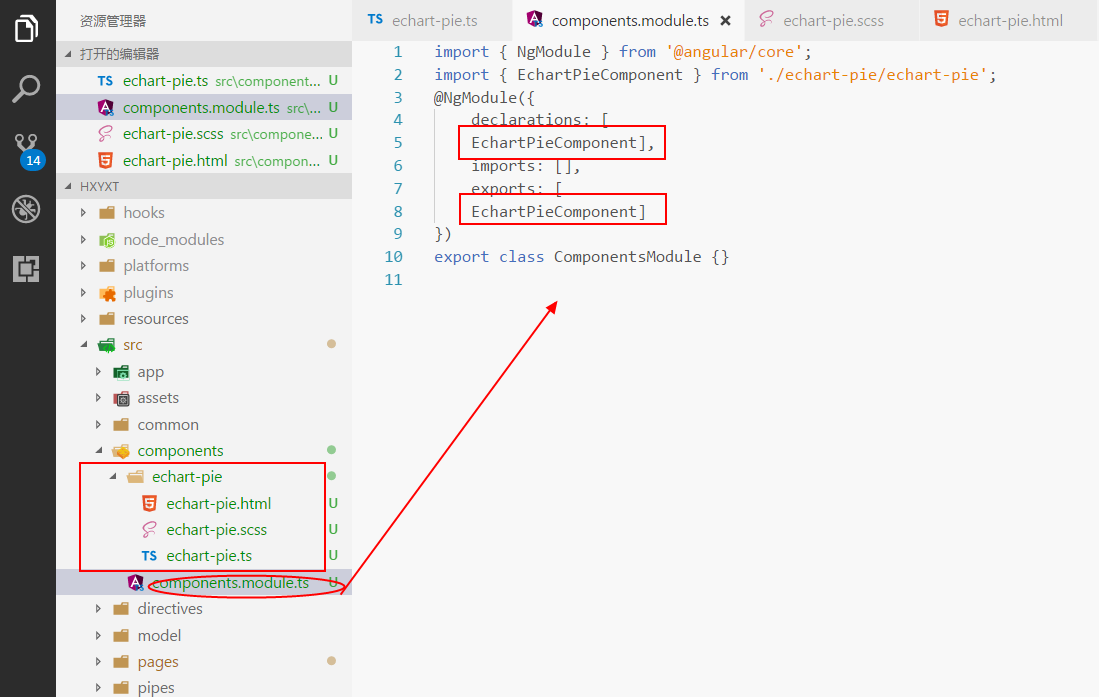
echart-pie.html文件:
<div #echart class="echart-pie"> </div>
echart-pie.scss文件:
echart-pie {
    .echart-pie {
        width: 100%;
        height: 380px;
    }
}
echart-pie.ts文件:
import { Component, OnInit, ElementRef, ViewChild } from '@angular/core';
import * as echarts from 'echarts'; //引入图表插件
@Component({
  selector: 'echart-pie',
  templateUrl: 'echart-pie.html'
})
export class EchartPieComponent implements OnInit {
  @ViewChild('echart') echart: ElementRef;//显示图形的容器
  //显示数据为官方文档数据
  pieChart = {
    //标题
    title: {
      text: '某站点用户访问来源',
      subtext: '纯属虚构',
      x: 'center'
    },
    //百分比提示信息
    tooltip: {
      trigger: 'item',
      formatter: "{a} <br/>{b} : {c} ({d}%)"
    },
    //用例
    legend: {
      orient: 'vertical',
      left: 'left',
      data: ['直接访问', '邮件营销', '联盟广告', '视频广告', '搜索引擎']
    },
    //扇形配置项
    series: [
      {
        name: '访问来源',
        type: 'pie',
        radius: '55%',
        center: ['50%', '60%'],
        data: [
          { value: 335, name: '直接访问' },
          { value: 310, name: '邮件营销' },
          { value: 234, name: '联盟广告' },
          { value: 135, name: '视频广告' },
          { value: 1548, name: '搜索引擎' }
        ],
        itemStyle: {
          emphasis: {
            shadowBlur: 10,
            shadowOffsetX: 0,
            shadowColor: 'rgba(0, 0, 0, 0.5)'
          }
        }
      }
    ]
  };
  constructor() {
  }

  ngOnInit() {
    this.getEchart();
  }

  getEchart() {
    //echarts初始化
    echarts.init(this.echart.nativeElement).setOption(this.pieChart, true);
  }
}
step3:在需要图形显示的位置调用该组件。
注意:在对应的module中引入该组件,以home为例.在home.module.ts中引入EchartPieComponent,如下:
import { NgModule } from '@angular/core';
import { IonicPageModule } from 'ionic-angular';
import { HomePage } from './home';
import { EchartPieComponent } from '../../components/echart-pie/echart-pie';

@NgModule({
  declarations: [
    HomePage,
    EchartPieComponent
  ],
  imports: [
    IonicPageModule.forChild(HomePage),
  ],
  exports: [
    HomePage
  ]
})
export class HomePageModule {}
在home.html中使用:
<ion-header>
    <ion-toolbar>
        <ion-title>重点关注</ion-title>
    </ion-toolbar>
</ion-header>

<ion-content>
    <echart-pie></echart-pie>
</ion-content>
step4:实现图例如下

over~